Heat Map in ArcGIS
What is Heat Map?
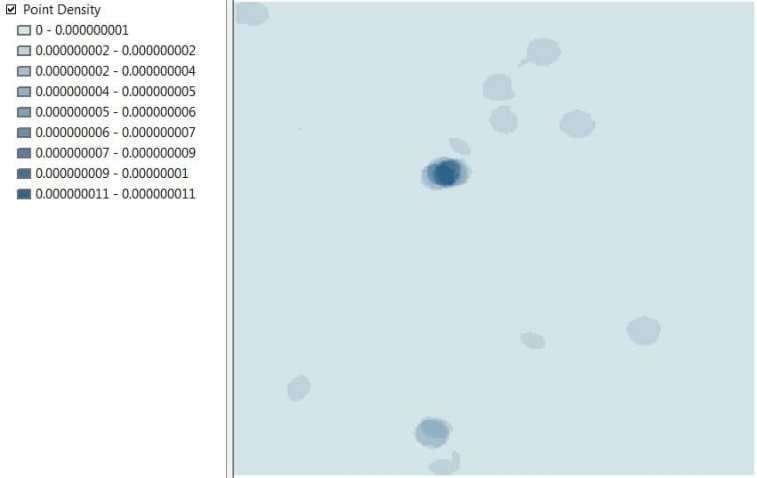
Heat maps are more of a visual aid than an accurate way to show point density. Create a heat map to visualize areas with the most point features as the hottest area.
Heatmap is an Interpolation technique useful in determining the density of input features.
In this tutorial learn How to create a Heat Map in ArcGIS.
How to Create Heat maps in ArcMap using the Density Toolset
In ArcMap, heat maps are created to visualize the density of geographic data.
Apply 3 methods to generate heat maps in ArcGIS Software:
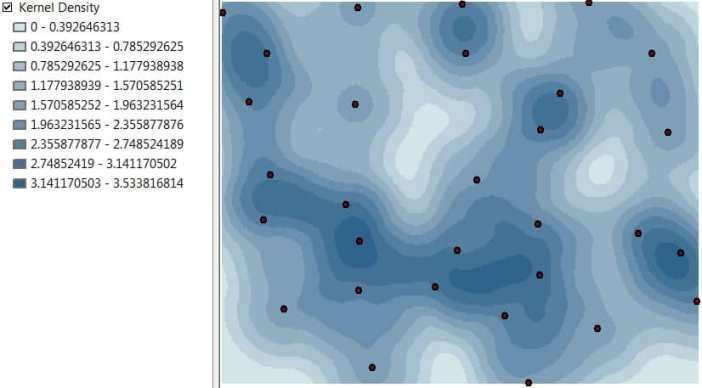
Make a Heat Map using Kernel Density tool
Calculates a magnitude per unit area from point or polyline features using a kernel function to fit a smoothly tapered surface to each point or polyline.
Steps :
1. Add point feature into ArcGIS Map zone.
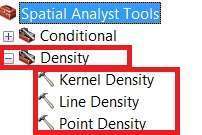
2. Open ArcToolbox, click Spatial Analyst Tools > Density > Kernel Density.
3. Kernel Density dialog box is open, Input point or polyline features field.
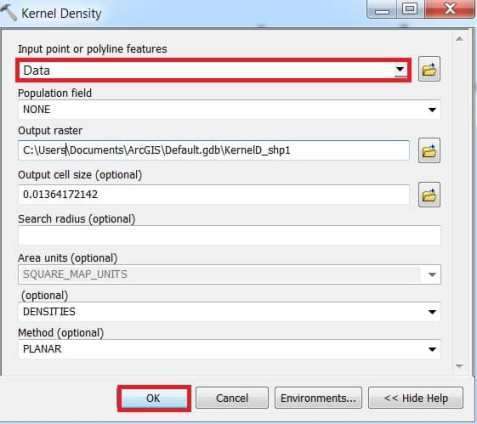
(if necessary, change the default values of the optional fields)
4. Click OK.
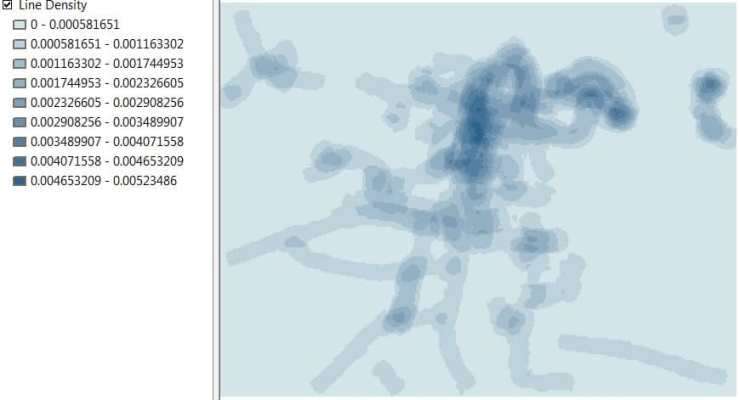
Make a Heat Map using Line Density tool
Calculates a magnitude per unit area from polyline features that fall within a radius around each cell.
Steps:
1. Add line feature into ArcGIS Map zone.
2. Open ArcToolbox, click Spatial Analyst Tools > Density > Line Density
3. Line Density dialog box is open, Input polyline features field.
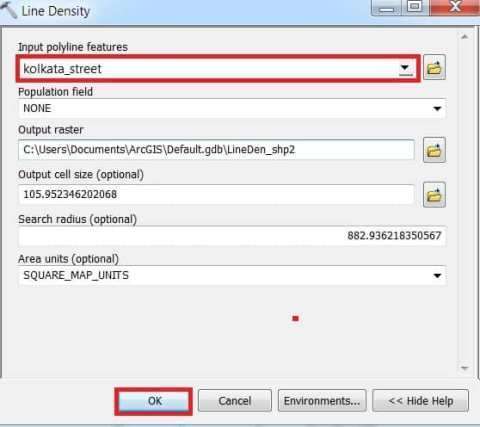
(if necessary, change the default values of the optional fields)
4. Click OK.
Make a Heat Map using Point Density tool
Calculates a magnitude per unit area from point features that fall within a neighborhood around each cell.
Steps:
1. Add point feature into ArcGIS Map zone.
2. Open ArcToolbox, click Spatial Analyst Tools > Density > Point Density
3. Point Density dialog box is open, Input point features field.
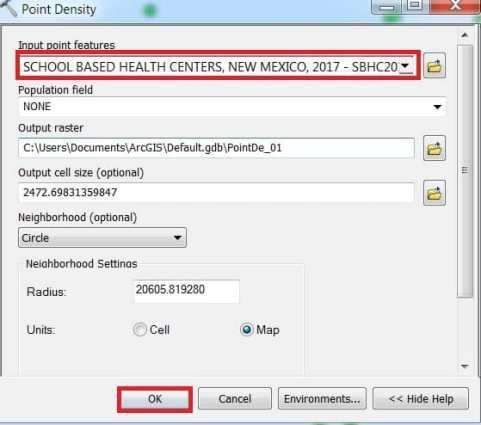
(if necessary, change the default values of the optional fields)
4. Click OK.