ArcGIS Spatial Analyst
The ArcGIS Spatial Analyst extension has over 170 Tools in 23 Toolsets for performing Spatial Analysis and Modeling, in GIS and Remote Sensing.
The ArcGIS Spatial Analyst extension provides a set of spatial analysis and modeling tools for both Raster and Vector (Feature) data.
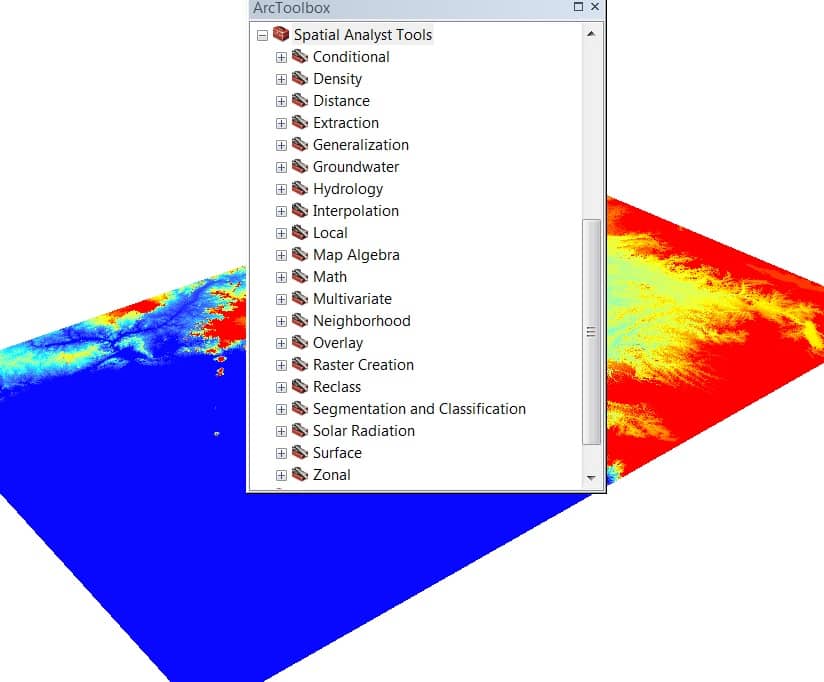
ArcGIS Spatial Analyst Toolbox and Toolsets
Toolset
Tools
Description
- Con
- Pick
- Set Null
The Conditional tools allow controlling of output values based on the conditions placed on the input values. The conditions that can be applied are of two types, (i) queries on the attributes or (ii) a Condition based on the position of the conditional statement in a list.
- Kernel Density
- Line Density
- Point Density
Density tools, use to calculate the density of input features within a neighborhood around the output raster cell.
- Corridor
- Cost Allocation
- Cost Back Link
- Cost Distance
- Cost Path
- Euclidean Allocation
- Euclidean Direction
- Euclidean Distance
- Path Distance
- Path Distance Allocation
- Path Distance Back Link
Distance tools allow you to perform distance analysis. Euclidean distance, Cost-weighted distance, Paths, and corridors between sources with the least cost of travel.
- Extract by Attributes
- Extract by Circle
- Extract by Mask
- Extract by Points
- Extract by Polygon
- Extract by Rectangle
- Extract Multi Values to Points
- Extract Values to Points
- Sample
The Extraction tools allow extracting a subset of cells from a raster by either the cells’ attributes or their spatial location.
- Aggregate
- Boundary Clean
- Expand
- Majority Filter
- Nibble
- Region Group
- Shrink
- Thin
Generalization tools used to either clean up small erroneous data in the raster or Generalize the data to get rid of unnecessary detail for a more general analysis.
- Darcy Flow
- Darcy Velocity
- Particle Track
- Porous Puff
The Groundwater tools can be used to perform rudimentary advection-dispersion modeling of constituents in groundwater flow. Groundwater tools can also be used in sequence to model and analyze groundwater flow.
- Basin
- Fill
- Flow Accumulation
- Flow Direction
- Flow Length
- Sink
- Snap Pour Point
- Stream Link
- Stream Order
- Stream to Feature
- Watershed
The Hydrology tools are used to model the flow of water across a surface. Also, it can be used in sequence to create a stream network or delineate watersheds.
- IDW
- Kriging
- Natural Neighbor
- Spline
- Spline with Barriers
- Topo to Raster
- Topo to Raster by File
- Trend
Interpolation tools create a continuous surface from sampled point values. Surface interpolation tools make predictions from sample measurements for all locations in an output raster dataset, whether or not a Measurement has been taken at the location.
- Cell Statistics
- Combine
- Equal to Frequency
- Greater Than Frequency
- Highest Position
- Less Than Frequency
- Lowest Position
- Popularity
- Rank
Local Tools, can combine the input raster, calculate a statistic on them, or evaluate a criterion for each cell on the output raster based on the values of each cell from multiple input rasters.
- Raster Calculator
Map Algebra performs spatial analysis by creating expressions in an algebraic language. With the Raster Calculator tool, you can easily create and run Map Algebra expressions that output a raster dataset.
- Abs
- Divide
- Exp
- Exp10
- Exp2
- Float
- Int
- Ln
- Log10
- Log2
- Minus
- Mod
- Negate
- Plus
- Power
- Round Down
- Round Up
- Square
- Square Root
- Times
General Math tools apply a mathematical function to the input. These tools perform basic mathematical operations, and various types of exponentiation operations, which includes exponentials and logarithms in addition to the basic power operations.
- Bitwise And
- Bitwise Left Shift
- Bitwise Not
- Bitwise Or
- Bitwise Right Shift
- Bitwise XOr
The Bitwise math tools compute the binary representation of the input values.
- Boolean And
- Boolean Not
- Boolean Or
- Boolean XOr
- Combinatorial And
- Combinatorial Or
- Combinatorial XOr
- Diff
- Equal To
- Greater Than
- Greater Than Equal
- In List
- Is Null
- Less Than
- Less Than Equal
- Not Equal
- Over
- Test
Math Logical tools evaluate the values of the inputs and determine the output values based on Boolean logic. The tools are grouped into four main categories: Boolean, Combinatorial, Logical, and Relational.
- ACos
- ACosH
- ASin
- ASinH
- ATan
- ATan2
- ATanH
- Cos
- CosH
- Sin
- SinH
- Tan
- TanH
Math Trigonometric tools perform various Trigonometric calculations on the values in an input raster.
- Band Collection Statistics
- Class Probability
- Create Signatures
- Dendrogram
- Edit Signatures
- Iso Cluster
- Iso Cluster Unsupervised Classification
- Maximum Likelihood Classification
- Principal Components
Multivariate perform the exploration of relationships among many different types of attributes. There are two types of multivariate analysis available :(i) Classification(Supervised and Unsupervised) and (ii) Principal Component Analysis (PCA).
- Block Statistics
- Filter
- Focal Flow
- Focal Statistics
- Line Statistics
- Point Statistics
Neighborhood tools create output values for each cell location based on the location value and the values identified in a specified neighborhood. The neighborhood can be of two types: (i) moving or (ii)search radius.
- Fuzzy Membership
- Fuzzy Overlay
- Weighted Overlay
- Weighted Sum
Overlay tools allow you to apply weights to several inputs and combine them into a single output. The most common application for Overlay tools is modeling.
- Create Constant Raster
- Create Normal Raster
- Create Random Raster
The Raster Creation tools generate new rasters in which the output values are based on a constant or statistical distribution.
- Lookup
- Reclass by ASCII File
- Reclass by Table
- Reclassify
- Rescale by Function
- Slice
Reclass tools perform a variety of methods that allow you to reclassify or change input cell values to alternative values.
- Classify Raster
- Compute Segment Attributes
- Segment Mean Shift
- Train Iso Cluster Classifier
- Train Maximum Likelihood
- Train Support Vector Machine Classifier
Segmentation and Classification tools can prepare segmented rasters to use in creating classified raster datasets.
- Area Solar Radiation
- Points Solar Radiation
- Solar Radiation Graphics
The Solar Radiation tools are used to map and analyze the effects of the sun over a geographic area for specific periods.
- Aspect
- Contour
- Contour List
- Contour with Barriers
- Curvature
- Cut Fill
- Hillshade
- Observer Points
- Slope
- Viewshed
- Viewshed 2
- Visibility
Surface tools, you can quantify and visualize a terrain landform represented by a Digital Elevation Model (DEM).
- Tabulate Area
- Zonal Fill
- Zonal Geometry
- Zonal Geometry as Table
- Zonal Histogram
- Zonal Statistics
- Zonal Statistics as Table
Zonal tools allow you to perform analysis where the output is a result of computations performed on all cells that belong to each input zone. Zones can be defined by raster or feature datasets. Rasters must be of integer type, and features must have an integer or string attribute field.

I have bore well water chemical data in an excel format with XY direction. How can I make water quality zonal polygon using arcgis10.6
Nice information about how