Introducing ERDAS IMAGINE Software
Erdas Imagine performs advanced remote sensing analysis and spatial modeling to create new information. In Erdas Imagine Software, you can visualize your results in 2D, 3D, movies, and on cartographic-quality map compositions. The core of the Erdas Imagine product suite is engineered to scale with your Geo-spatial data production needs.
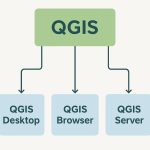
Erdas Imagine provides 3D visualization of digital surface models, point clouds, raster and vector feature data. It is easy-to-use, raster-based software designed specifically to extract information from images.
Erdas is the most powerful package for derived information (data production), supporting multiple workflows, including:
- Data conversion
- Orthorectification
- Feature capture and update
- Spatial modeling and analysis
- LiDAR editing and classification
- Terrain creation, editing and analysis
- Color balancing, mosaicking and compression
- Land-cover mapping and terrain categorization
- Map and report generation and printing through the map composer or Microsoft PowerPoint or Word.
Download Erdas Imagine Software
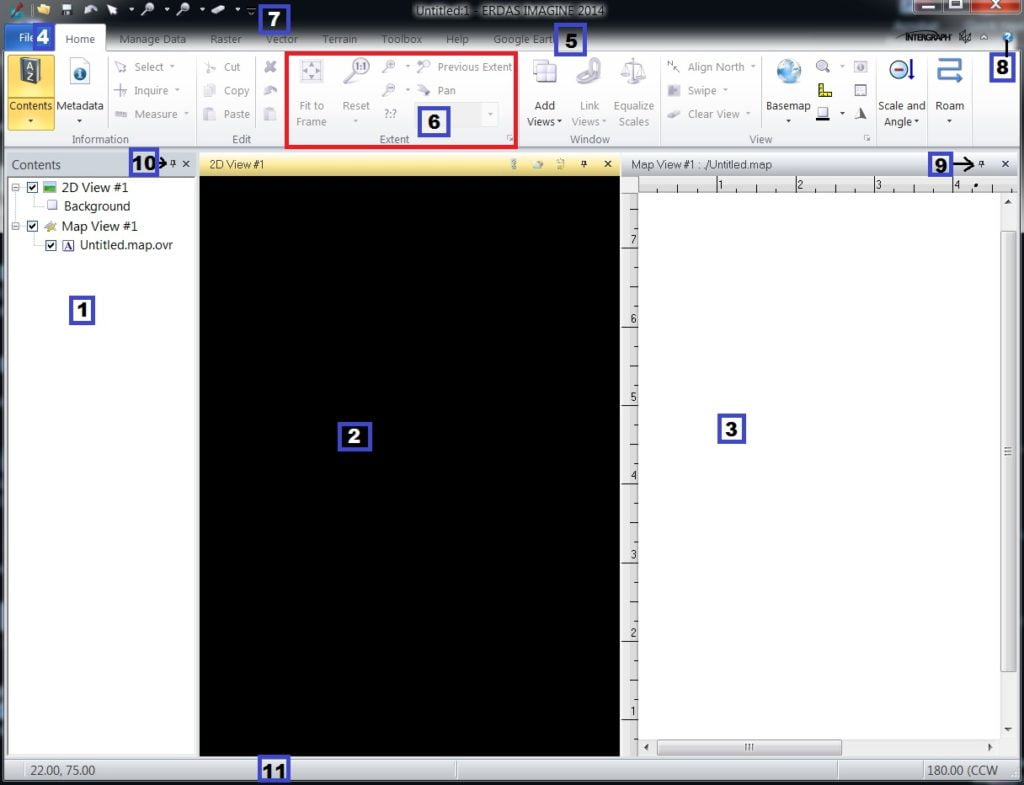
- Contents Panel
- 2D View
- Map View
- File button
- Main menu (Tab)
- Sub–menu (Tab group)
- Quick Access Toolbar
- Help button
- Dock or Undock Views
- Hide/Show Panel
- Status Bar
Start Erdas Imagine
If you already installed Erdas Imagine software, Started it.
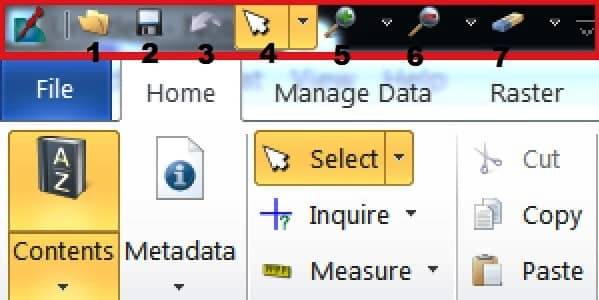
Quick Access Toolbar
The Quick Access Toolbar is a toolbar you build by placing icons of frequently-used tools in a custom toolbar. The default location of this toolbar is in the upper left portion of the Title Bar in IMAGINE Workspace.
These tools are the same as the corresponding tools on the Home tab.
- Open
- Save
- Undo
- Select
- Zoom In
- Zoom Out
- Clear View
Main Menu
When Erdas Imagine is opened the menu bar positioned at any convenient place on the screen, contains, through a series of drop-down menus.
Total seven main menus are available, 6 are important menus, and one is Help menu.
- Home
- Manage Data
- Raster
- Vector
- Terrain
- Toolbox
- Help
File
The File Button is available to control various functions such as opening Views and projects, saving in multiple formats, as well as control of Preferences and Session Log.
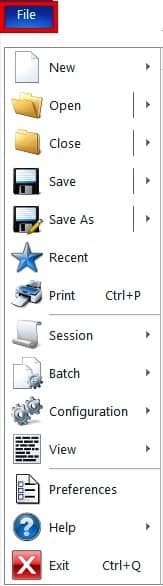
Click the File Button to open the main menu dialogs. See below for details:
- New– Create a New Window/View (Map View, 2D/3D View)
- Open– Open types of File or Layer (Raster, Vector, AOI Layer)
- Close– Close the Layer or View
- Save– Save to Current File
- Save As– Save a New File
- Recent– Show the Recent Documents
- Print– Print the current map composition
- Session– Current IMAGINE session
- Batch– Creating Batch jobs to process multiple files
- Configuration– Configure IMAGINE functions
- View– View and edit various text and image files
- Preferences– The Preference Editor controls many IMAGINE parameters and defaults
- Help– Information about ERDAS IMAGINE
- Exit– End the current IMAGINE session
Home Menu
The Home tab, consisting of tool tab groups for information, editing, selection, and magnification of imagery.
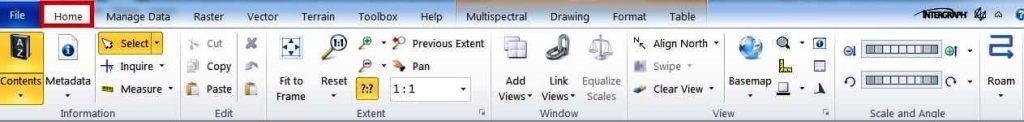
Home tab is grouped into these categories:
- Information– Contents, Metadata, Select, Inquire, Measure
- Edit– Cut, Copy, Paste, Delete, Undo, Paste from Selected Object
- Extent– Fit to Frame, Reset, Zoom In, Zoom Out, Relative Scale, Previous Extent, Scale
- Window– Add Views, Link Views, Equalize Scales
- View– Align North, Swipe, Clear View, Basemap, New Inset Viewer, Place Scale Bar, Background Colors, Display Style and Symbology, Properties, Place North Arrow
- Scale and Angle– Zoom In and Zoom Out increment, Rotate clockwise and counter clockwise
- Roam– Horizontal, Vertical, or User-Defined
Manage Data Menu
The Manage Data tab contains tools that are useful in general data preparation. You can also send data to Microsoft PowerPoint, Word, or save directly as a JPEG image.
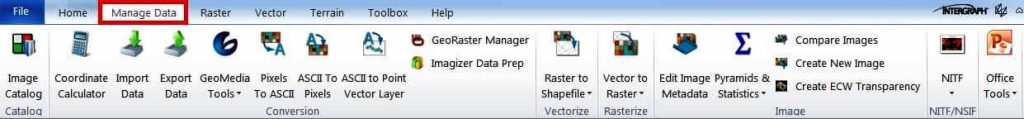
Manage Data tab is grouped into these categories:
- Catalog– Image Catalog managing raster image information and selecting files geographically
- Conversion– Coordinate Calculator, Import and Export Data, GeoMedia, convert Pixels to ASCII and ASCII to Pixels, ASCII to X,Y point, GeoRaster Manager, Imagizer Data Prep
- Vectorize– Raster to Shapefile and Annotation
- Rasterize– Vector to Raster, and Annotation to Raster
- Image– Edit Image Metadata, Pyramids & Statistics, Compare Images, Create New Image, Create ECW Transparency
- NITF/NSIF– View NITF Metadata, Extract Shapefile and LAS File
- Office Tools– Send to PowerPoint, Word, JPEG
Raster Menu
The Raster tab contains tools for enhancing raster data, mosaicking images, classifying data, change detection analysis, radar data analysis, modifying thematic data, and Fourier analysis.
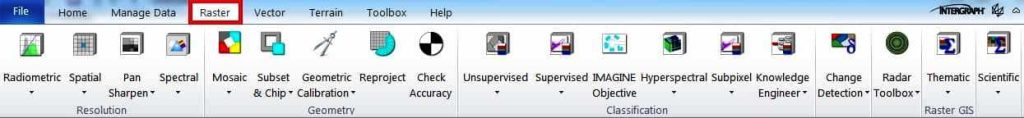
Raster tab is grouped into these categories:
- Resolution
- Geometry
- Classification
- Change Detection
- Radar Toolbox
- Raster GIS
- Scientific
Vector Menu
The Vector tab contains tools for working with shapefiles and other vector data. Use these tools to reproject, subset, and convert elevation data in shapefiles, and convert raster data to shapefiles.
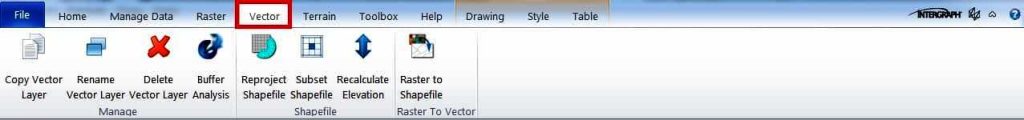
Vector tab is grouped into these categories:
- Manage
- Shapefile
- Raster to Vector
Terrain Menu
The Terrain tab contains tools for working with Terra Model layers.

Terrain tab is grouped into these categories:
- Manage Terrain
- Analysis
- Point Cloud
Toolbox Menu
The Toolbox tab contains the Photogrammetry module (photogrammetric production tools), The tools contained in this tab are shown if the corresponding module has been purchased and installed.
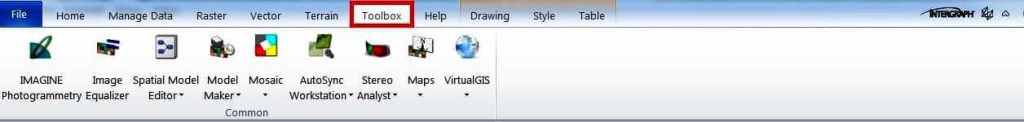
Toolbox tab is grouped into these categories:
- Common
- IMAGINE Photogrammetry
- Image Equalizer
- Spatial Model Editor
- Model Maker
- Mosaic
- AutoSync Workstation
- Stereo Analyst
- Maps Series
- VirtualGIS
Help Menu
The Help tab, consisting of a search field where you can enter text to locate tools, modules.
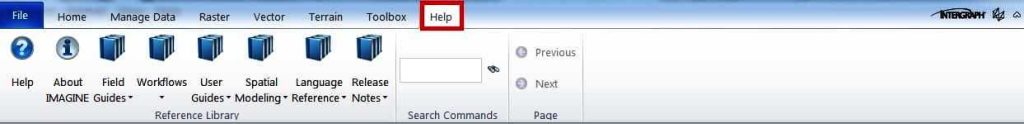
Help tab is grouped into these categories:
- Reference Library
- Search Commands
- Page
- Results
These tools are the same as the corresponding tools on the Home tab.