The first system to be called a GIS was the Canadian Geographic Information System, developed in 1962 by Roger Tomlinson of the Canada Land Inventory. Unlike earlier systems that were developed for a specific application, this system was designed to store digitized map data and landbased attributes in an easily accessible format for all of Canada. This system is still in operation today (Parent and Church, 1987).
GIS- Geographic Information System
The full form of GIS is the Geographic Information System. It is an Information system designed to work with data references by Geographical or Spatial Coordinates. The below discussion is about the actual meaning of GIS.
GIS Podcast (Aduio)
What is the Geographic Information System?
Geographic Information is a geographical information or data to collect different sources, then systematically analyze data and making maps.
- Geographic– data collected is associated with some location in space.
- Information–attributes, or the characteristics (data), can be used to symbolize and provide further insight into a given location.
- System–a seamless operation linking the information to the geography, which requires hardware, networks, software, data, and operational procedures.
Meaning of GIS
The actual meaning of GIS is a computer-based system including software, hardware, people, and geographic information. GIS can create, edit, query, analyze, and display map information on the computer.
Key Components of GIS
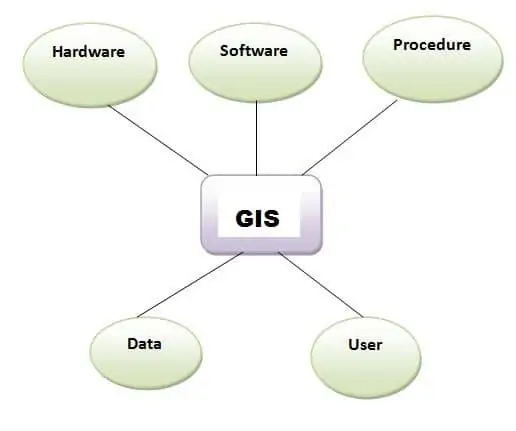
The 5 main Components of Geographic Information Systems are:
- Hardware – Computers, GPS devices, servers.
- Software – GIS programs (e.g., ArcGIS, QGIS).
- Data – Spatial data (maps, satellite imagery, shapefiles) and attribute data (tabular info).
- Methods – Procedures and techniques for analysis.
- People – GIS analysts, cartographers, decision-makers.
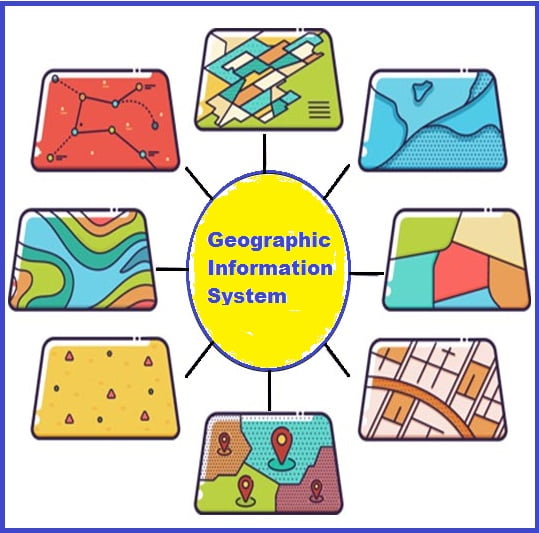
Applications of GIS
The Common GIS Applications are:
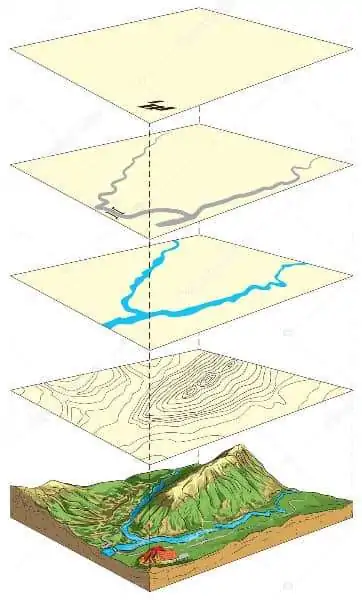
Types of GIS Data
Basically, two types of GIS Data:
Raster Data
Raster Data is a Pixel value, also defines Grid and Cell. It represents continuous data such as elevation, slope, surfaces.
–Satellite images and aerial photos are in this format.
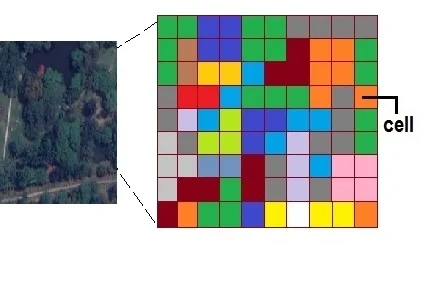
- Grid and cells
- For continuous data such as elevation, slope, surfaces
Vector Data
Vector Data is simply ‘XY’ coordinates. They are a latitude and longitude value.
– The vector data represents are points, lines, and polygons.
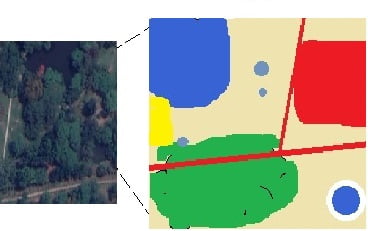
- A series of x, y coordinates
- For discrete data represented as points, lines, polygons
Popular GIS Software
The common GIS Software are:
- ArcGIS (by Esri)
- QGIS (Open source)
- GRASS GIS
- MapInfo
- Google Earth Engine (cloud-based)
Spatial Data Analysis
Spatial Data known as Geo-spatial data is information about a physical object that can be represented by numerical values in a Geographic Coordinate System (GCS).
The spatial data represents the location, size, and shape of an object on planet Earth, such as a building, lake, mountain, or township.
Geospatial Analysis
The Geo-spatial is modeling, examining, and interpreting model results. Spatial analysis is useful for evaluating suitability and capability, for estimating and prediction, interpreting, and understanding.
Geospatial Data Analysis Methods
Overlay Analysis
There are two methods for performing overlay analysis—feature overlay or Vector Overlay (overlaying points, lines, or polygons) and Raster Overlay. Overlay analysis to find locations meeting certain criteria is often best done using raster overlay. Of course, this also depends on whether your data is already stored as features or rasters. It may be worthwhile to convert the data from one format to the other to perform the analysis.
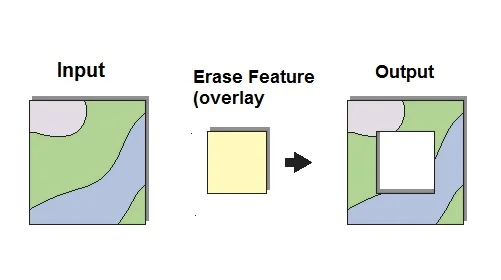
Vector overlay
The key elements in the feature overlay are the input layer, the overlay layer, and the output layer. The overlay function splits features in the input layer, where they are overlapped by features in the overlay layer.
Below is an example of Erase overlay.
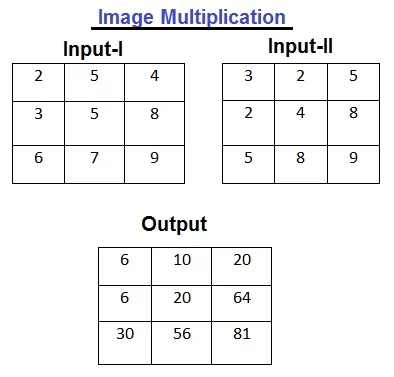
Raster overlay
In the raster overlay, each cell of each layer references the same geographic location. That makes it well suited to combining characteristics for numerous layers into a single layer. Usually, numeric values are assigned to each characteristic, allowing you to mathematically combine the layers and assign a new value to each cell in the output layer.
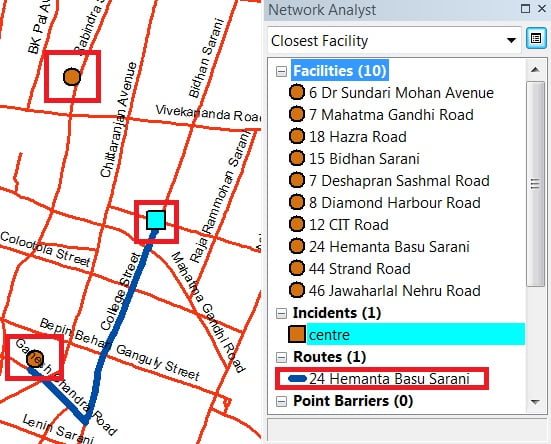
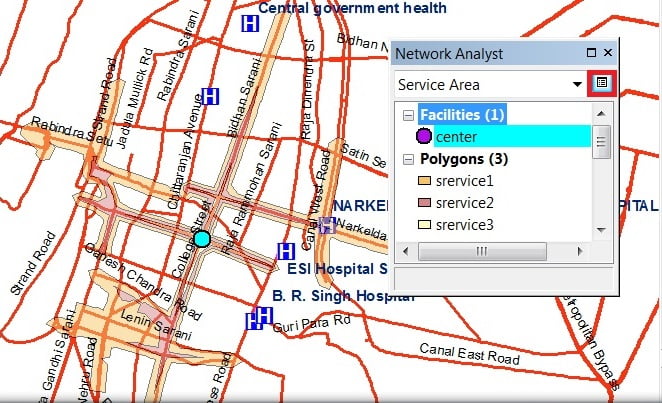
Network Analysis
The Network Analyst Extension allows you to solve common network problems, such as finding the best route across a city, finding the closest emergency vehicle or facility, identifying a service area around a location, servicing a set of orders with a fleet of vehicles, or choosing the best facilities to open or close.
Network Analysts can find the best way to get from one location to another or to visit several locations. The locations can be specified interactively by placing points on the screen, entering an address, or using points in an existing feature class or feature layer.

Surface Analysis
Surface Analysis represents phenomena that have values at every point across their extent. The values at the infinite number of points across the surface are derived from a limited set of sample values. such as height values for an elevation surface, or temperature values for a temperature surface; between these measured locations, values are assigned to the surface by interpolation.
The following are a selection of the many applications for surface analysis tools.
Type of Analysis | Surface Tools | Application |
|---|---|---|
Surfaces Analysis | You might want to know the variations in the slope of the landscape because you want to find the areas most at risk of landslide based on the angle of steepness in an area. | |
You might be a farmer who is interested in locating a field in an area with a southerly aspect. | ||
You might be a farmer who is interested in locating a field in an area with a southerly aspect. | ||
Creating Contours | Contours can be useful for finding areas of the same value. You could be interested in obtaining elevation values for specific locations and examining the overall gradation of the land. | |
Visibility Analysis | Calculating viewshed is useful when you want to know how visible objects will be. For instance, you might want to find the location with the most expansive view in an area because you want to choose the best location for an observation tower or scenic overlook. | |
Terrain relief and visualization | You can create hillshade for both graphic and analytic purposes. Graphically, a hillshade can provide an attractive and realistic backdrop, showing how other layers are distributed in relation to the terrain relief. From an analytic point of view, you can analyze how the landscape is illuminated at various times of the day by lowering and raising the sun angle. | |
Volumetric Analysis | You may be leveling a site for building construction and want to determine the volume of material that needs to be excavated and dumped. Another use is to identify areas of sediment erosion and deposition in a river valley. |
Geodatabase
The Geodatabase is a collection of geographic datasets of various types.
An ArcGIS Geodatabase is a collection of geographic datasets of various types held in a common file system folder, a Microsoft Access database, or a multi-user relational DBMS (such as Oracle, Microsoft SQL Server, PostgreSQL, Informix, or IBM DB2).
Geocoding
Geocoding is the process of transforming a description of a location—such as a pair of coordinates, an address, or a name of a place—to a location on the earth’s surface. You can Geocode by entering one location description at a time or by providing many of them at once in a table. The resulting locations are output as geographic features with attributes, which can be used for mapping or spatial analysis.
Geoprocessing
Geoprocessing provides a large suite of tools for performing GIS tasks that range from simple buffers and polygon overlays to complex regression analysis and image classification. The tasks can be quite creative, using a sequence of operations to model and analyze complex spatial relationships. for example, calculating optimum paths through a transportation network, predicting the path of the wildfire, analyzing and finding patterns in crime locations, predicting which areas are prone to landslides, or predicting flooding effects of a storm event.
The Geoprocessing is based on a framework of data transformation. A typical geoprocessing tool an operates on an ArcGIS dataset, it’s produces a new dataset as the result of the tool. Each geoprocessing tool performs a small yet essential operation on geographic data.