Network Analysis in GIS
What is Network Analysis?
Network analysis solving network problems such as traversability, rate of flow, or capacity, using network connectivity.
Network Analysis in GIS
In GIS a Network Analysis is a system of interconnected elements, such as edges (lines) and connecting junctions (points), that represent possible routes from one location to another.
It is the process of using geographic data to model and analyze real-world networks such as roads, pipelines, electric grids, or pedestrian walkways. It answers questions related to connectivity, flow, and optimal routing.
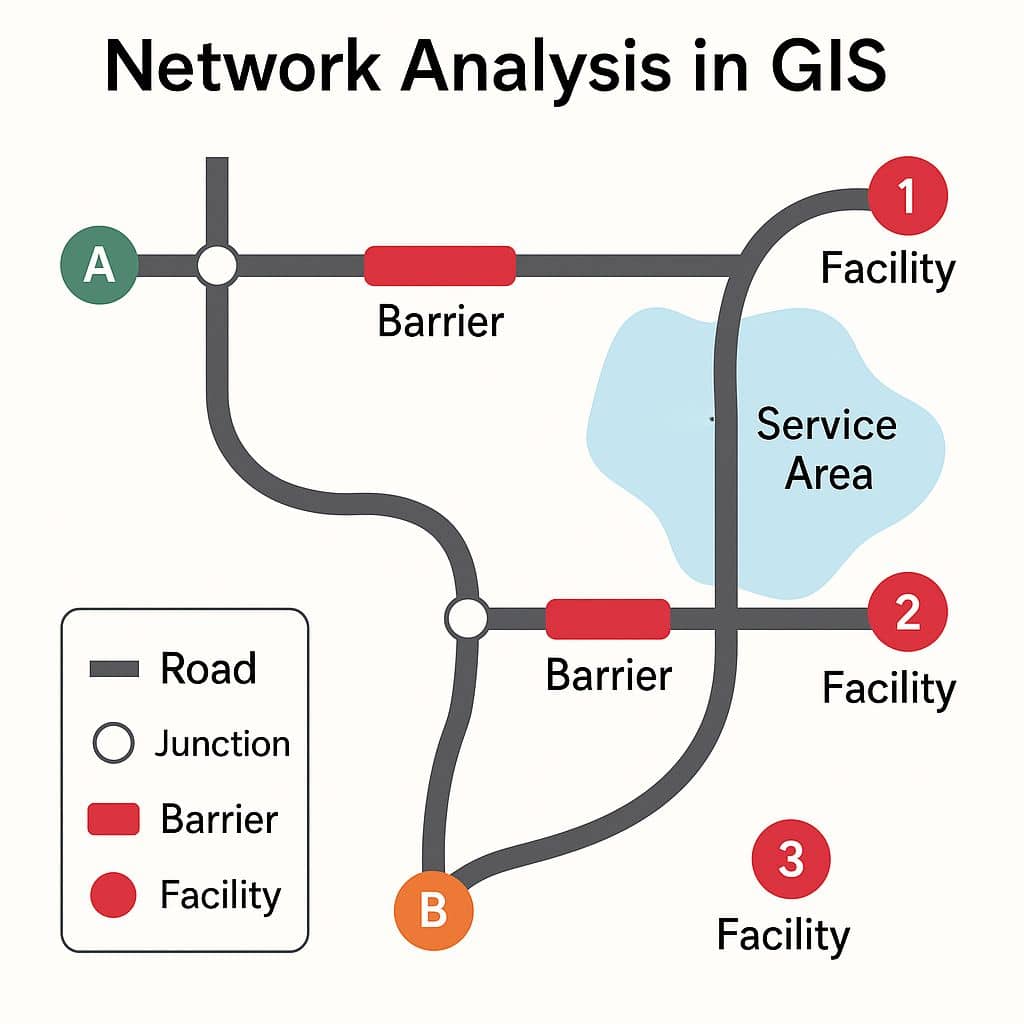
Applications of Network Analysis:
| Application | Description |
|---|---|
| Route Finding | Find the shortest or fastest path between two or more locations |
| Service Area | Define areas reachable within a time/distance (e.g., 10-minute drive) |
| Closest Facility | Identify the nearest hospital, fire station, ATM, etc. |
| Origin-Destination Cost Matrix | Compute travel cost between many origins and destinations |
| Vehicle Routing Problem (VRP) | Optimize delivery/pickup routes for multiple vehicles |
| Location-Allocation | Find the best location for services (e.g., stores, stations) based on demand |
Network Dataset in GIS
The Network Analysis in GIS is based on the mathematical sub-disciplines of graph theory and Topology. The network analysis in GIS consists of a set of connected vertices and edges.
Network datasets is a model of transportation networks. They are created from source features (lines and points).
When you perform an analysis using the ArcGIS Network Analyst extension, the analysis always connected on a network dataset.
Key Components in a Network Dataset:
| Component | Description |
|---|---|
| Edges | Line features (e.g., roads, pipes) that represent connectivity |
| Junctions | Nodes where edges connect (e.g., intersections) |
| Turns | Rules for movement through junctions (e.g., turn restrictions) |
| Impedance | Travel cost (time, distance, fuel) assigned to each edge |
| Barriers | Obstacles or restrictions (e.g., road closures) |
Creating a Network Dataset
In this Tutorial, perform Network analysis in ArcGIS using kolkata street dataset.
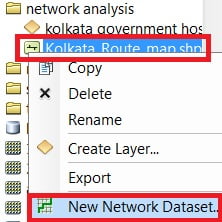
1. Right click the street feature dataset (kolkata_route_map) and click New > Network Dataset.
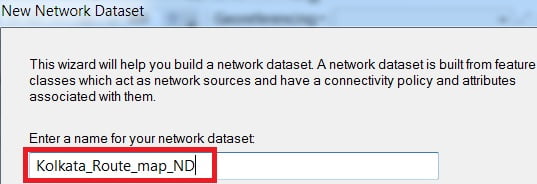
2. The New Network Dataset wizard opens, enters the Name, and Click Next. Click Yes to model turns in the network and click Next.
3. Click Connectivity, the Connectivity dialog box opens. Here you can set up the connectivity model for the network. For this Streets Feature class, all streets connect to each other at endpoints. Make sure that the connectivity policy of Streets is set to End Point. Click OK to return to the new Network Dataset wizard, and Click Next.
4. would you like to model this Elevation of your network features, choose None and click Next.
5. Setting network attributes is display, all are default setting is OK, click Next and skip it.
6. Click Yes to set up directions, Click Directions. The Network Directions Properties dialog box open. On the General tab, you also change length units.
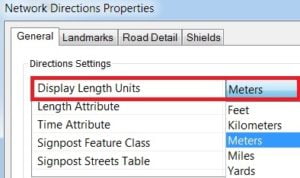
Now set the Direction, click Next. A summary of all the settings is displayed for your review, click Finish

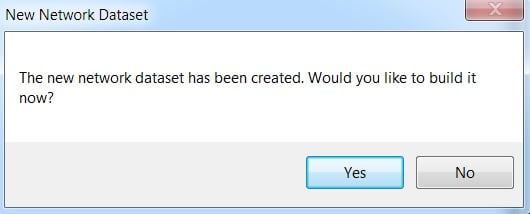
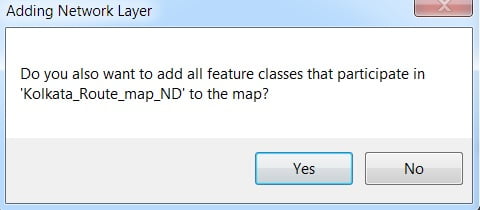
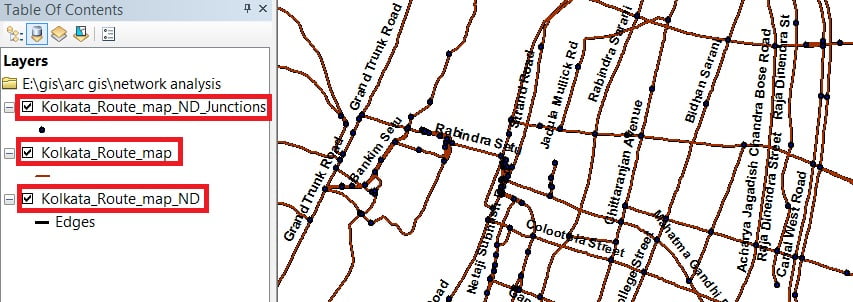
Finish the Network Dataset, build Network Dataset message box is appears, click Yes. Then choose all are dataset Add in ArcMap, yon can choose Yes, otherwise next time drag and add the dataset.
Create Network Analysis in ArcGIS
The Network Dataset process is competed, now time to creating network analysis layers. There main analysis layer to o solve common network problems;
- Best Route (Shortest Path)
- Closest Facility
- Service Areas
ArcGIS Network Analyst Extension:
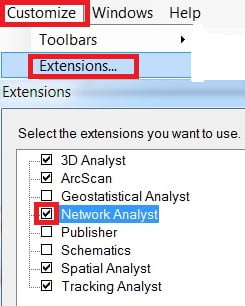
Before creating Network Analysis, Enable the ArcGIS Network Analyst extension.
1. Customize > Extensions. The Extensions dialog box open, Check Network Analyst and Click Close.
2. Now open Network Analyst Toolbar. Click Customize > Toolbars > Network Analyst.
Finding the Best Route Using a Network Dataset
Network Analyst can find the best way to get from one location to another or to visit several locations.
Now just open your network dataset route (Kolkata_route_map_ND), and kolkata govt. hospital.
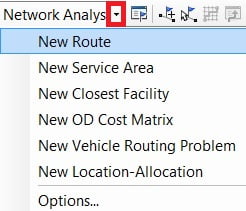
1. Now add Network Analyst Toolbar, Click Network Analyst Drop-down and select New Route.
2. On the Network Analyst toolbar, click the Network Analyst window button. The route analysis layer is added to the Network Analyst window (Stops, Routes, Point Barriers, Line Barriers, and Polygon Barriers).
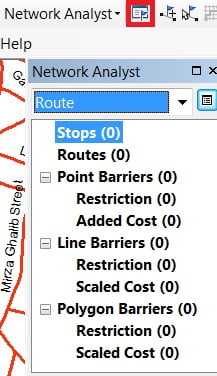
The analysis layer is also added to the Table Of Contents window.
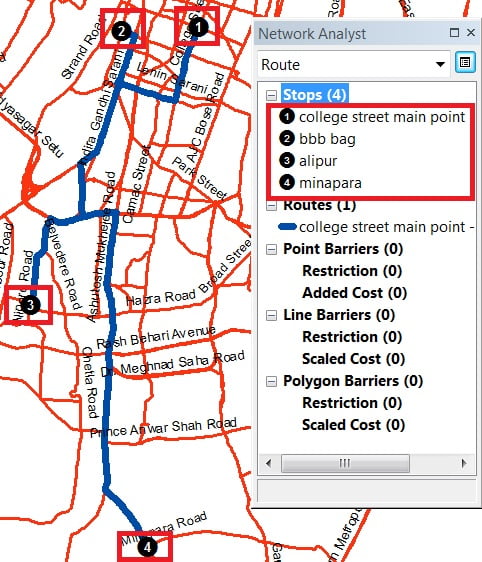
3. In the Network Analyst window, click Stops. On the Network Analyst toolbar, click the Create Network Location Tool and Click anywhere on the street network to define a new stop location.
4. Now click the Slove button. Network Analyst calculates the best route.

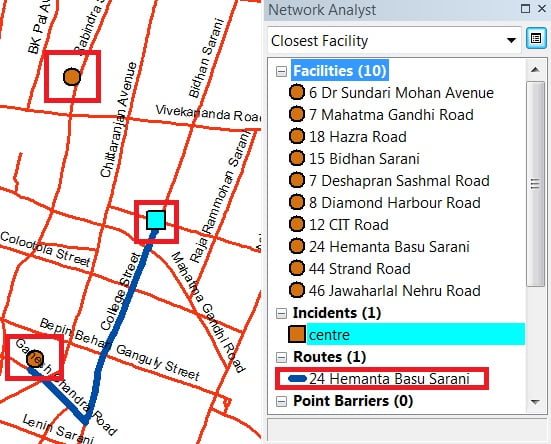
Closest Facility
Finding the closest hospital to an accident, the closest store to a customer’s address are all examples of closest facility problems.
Follow the same process to previous exercise.
1. Click Network Analyst Drop-down and select New Closest Facility.
2. The closest facility analysis layer is added to the Network Analyst window(Facilities, Incidents, Routes, Point Barriers, Line Barriers, and Polygon Barriers).
The analysis layer is also added to the Table Of Contents window
3. you will load facilities from a point feature layer that represents kolkata govt. hospital
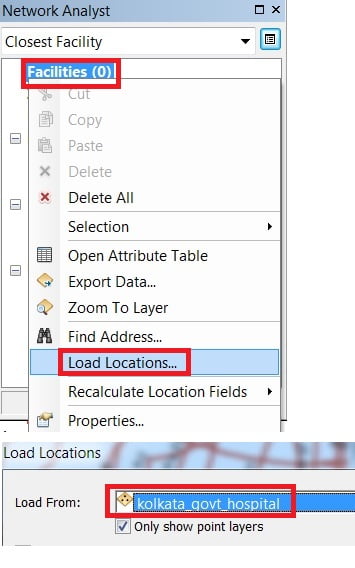
4. In the Network Analyst window, right-click Facilities and click Load Locations. The Load Locations dialog box open, Choose kolkata_govt_hospital from the Load From drop-down list and click OK.
5. The next step is to add Incidents. In the Network Analyst window, right-click Incidents, and choose Find Address.
6. Now click the slove button. Network Analyst calculates the closest facility on the basis of incidents.
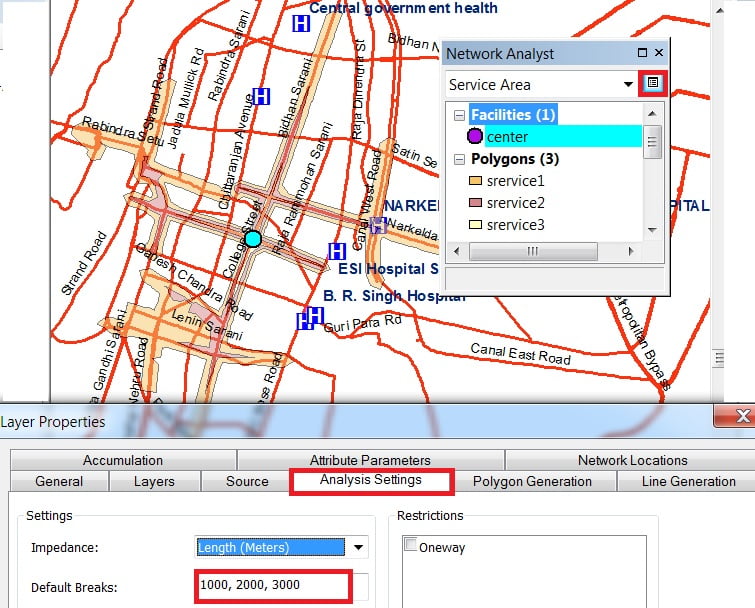
Calculating Service Area
You can find service areas around any location on a network.
1. Click Network Analyst on the Network Analyst toolbar and click New Service Area.
2. The service area analysis layer is added to the Network Analyst window (Facilities, Polygons, Lines, Point Barriers, Line Barriers, and Polygon Barriers).
The analysis layer is also added to the Table Of Contents window.
3. Now you will add facilities by using create network location tool (you can also load facilities) for which the service area polygons will be generated.
4. Click the Analysis Layer Properties button on the Network Analyst window, and go to Analysis Settings the tab.
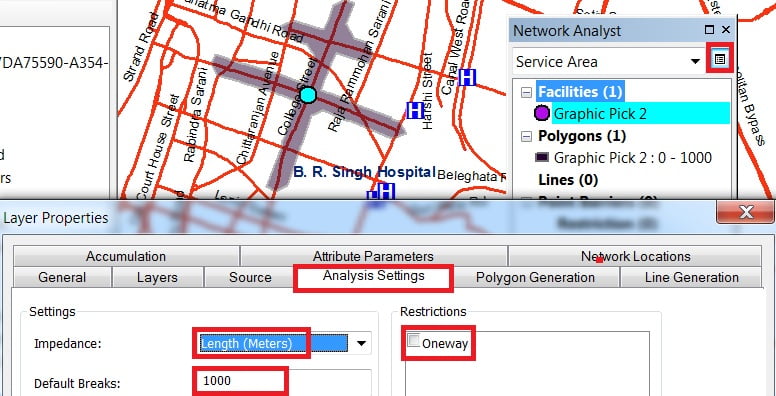
5. Setting Default Breaks (single-1000 m, or multiple-1000, 2000, 3000m). Check One-way in the Restrictions list.
This definitely be the next preference. You are perfect, theme team. I Really enjoy the system, fonts along with the perfect subject. Thanks for a great valuable design. Great job, Keep up the ultra do the webjob!
Thank you so much
Well, I do not know if that is going to work for me, but definitely worked for you! Excellent post!
i wish, definitely it’s doing work for you. thank you for your feedback.