Unsupervised Classification Using QGIS Software
In this tutorial perform Unsupervised Classification in QGIS Software.
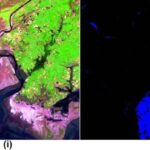
Before star the classification, Download a Satellite image.
Perform Unsupervised Image Classification
Semi-Automatic Classification Plugin
Follow this tutorial- How to Install and Manage Semi-Automatic Classification Plugin.
Create a Band set
1. Add all the band images (LISS-3) into the QGIS interface.
2. Now Open the SCP Band Set window with SCP > Band Set from the Main Menu.
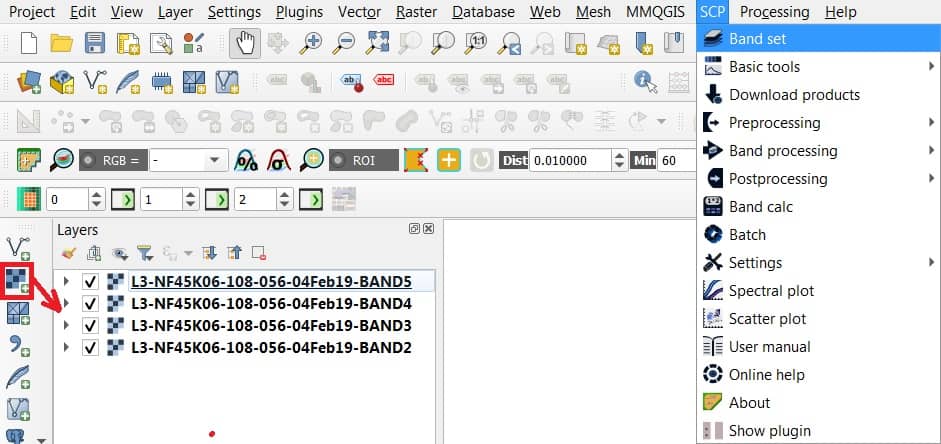
3. Click the Refresh list button to bring in the bands you just loaded into SCP Band Set window.
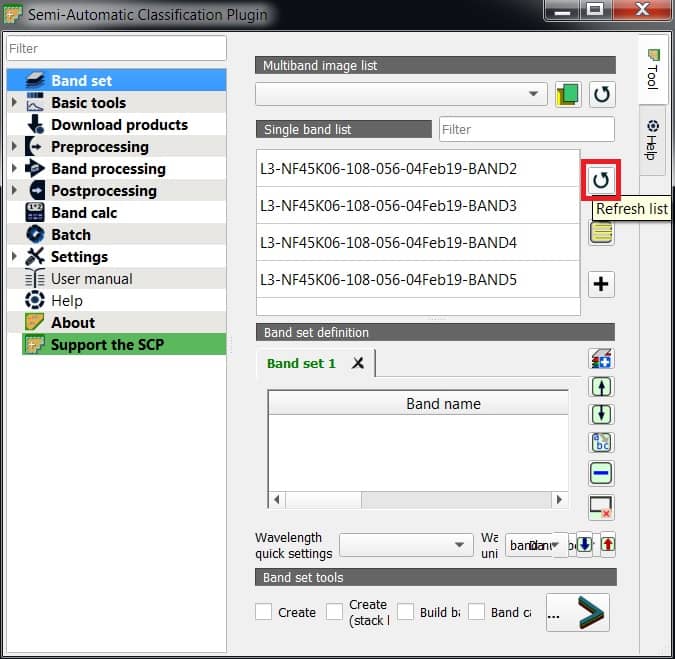
4. Select all the bands and click the Add band to band set button to add the bands to the band set section.
(Make sure the bands are in the right order and ascending.)
5. In the Band set tool section, click Create virtual raster check box, and click RUN.
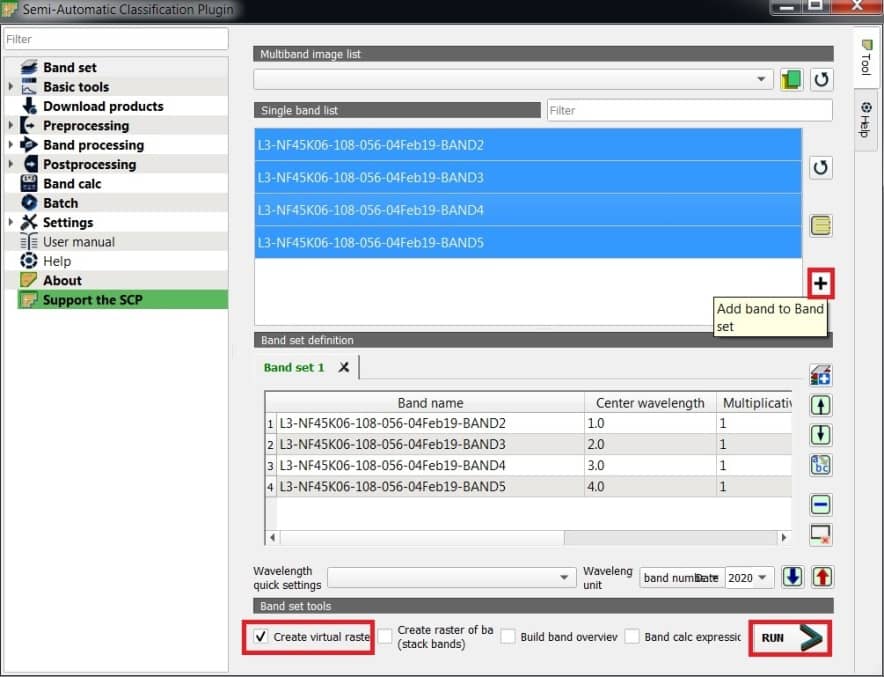
6. Select your destination folder to Save the data.
Virtual Raster Band set
After the complete process, the result is displayed in the Layer section.
1. Select the virtual data (ex.- L3-NF45K06-108-056-04Feb19-BANDvirt_rast), right click then select Properties.
2. The Properties pane appears, select Symbology.
3. In Rander type, choose Multiband color, then choose bands; Red band-4, Green band-3, Blue band-2.
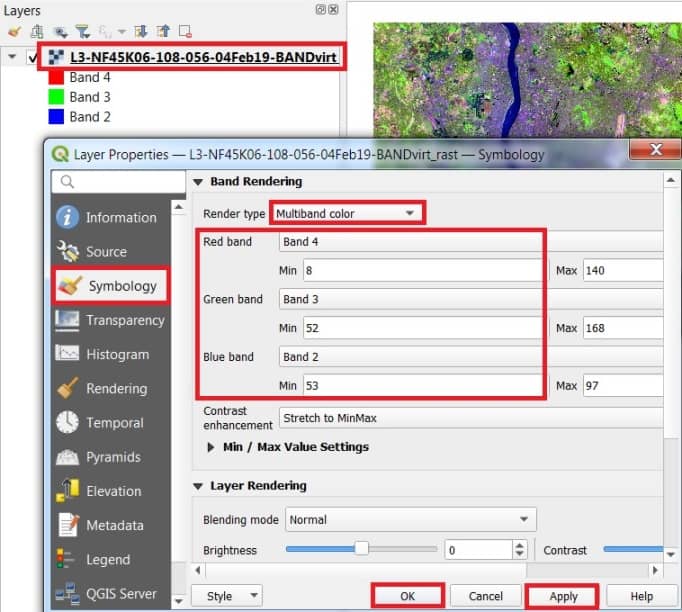
4. Finally click Apply > OK.
Perform K-Means Classification
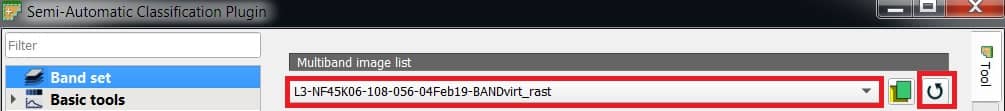
Before start Classification, select the virtual data SCP Band Set section. Click Refresh list button, and select data (ex.- L3-NF45K06-108-056-04Feb19-BANDvirt_rast)
1. Go to SCP > Band Processing > Clustering, clicking the button in the SCP menu or the SCP dock.
2. Select Input band set– 1, because we are going to classify the first Band set.
3. In Method check K-means.
4. In Distance threshold set 0.01, which is the distance required for merging clusters.
- [For K-means: iteration is terminated if distance is lower than threshold.]
- [For ISODATA: signatures are merged if distance is greater than threshold]
5. In Number of classes set 10 (the maximum number of classes define better land cover classification)
6. In Max number of iterations set 10 (maximum number of iterations if Distance threshold is not reached).
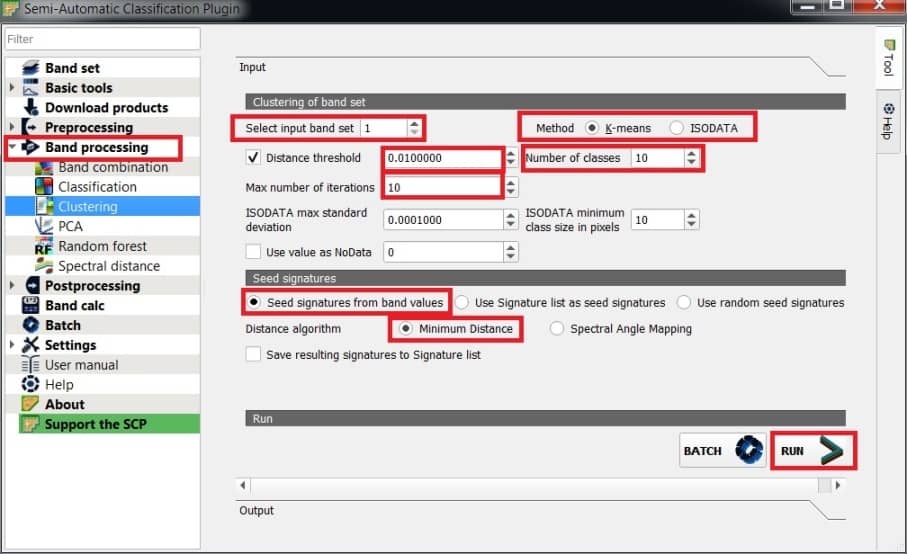
7. Check the option Use random seed signatures.
- [Seed signatures from band values: divides the spectral space of the Band set to get spectral signatures.]
- [Use Signature list as seed signatures: uses the spectral signatures checked in ROI & Signature list.]
- [Use random seed signatures: randomly selects the spectral signatures of pixels in the Band set.]
8. In Distance algorithm, choose Minimum Distance.
[Save resulting signatures to Signature list: save the resulting spectral signatures in the ROI & Signature list]
9. Now click the RUN button and define the folder to Save classification output.
After the process is completed, the result is displayed in the map. The result of unsupervised classification, the number of classes can vary depending on the various iterations.
Define all the classes, which Cluster ID involve which class category, compare to your RGB satellite image.
Please note that you should define different values according to the result of your classification output.
| Class name | Cluster ID | New class ID |
|---|---|---|
| Water body | 1 | 1 |
| Built-up | 2 | 2 |
| Built-up | 3 | 2 |
| Vegetation | 4 | 3 |
| Cultivation | 5 | 4 |
| Cultivation | 6 | 4 |
| Waste land | 7 | 5 |
| Cultivation | 8 | 4 |
| Waste land | 9 | 5 |
| Vegetation | 10 | 3 |
Reclassification
Now you can reclassify the unsupervised classification image.
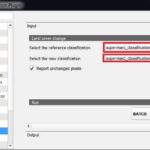
1. Open the SCP > Postprocessing > Reclassification, clicking the button in the SCP menu or the SCP dock.
2. In the Reclassification, click the Refresh list button to Select the classification data (unsupervised _classification).
3. Click Calculate unique values to automatically calculate unique values in the classification.
4. Fill the New values into the New value column for set the corresponding New class ID in reclassification table.

5. When the table is complete, click the RUN button and define the output folder to Save it.
Final Classification
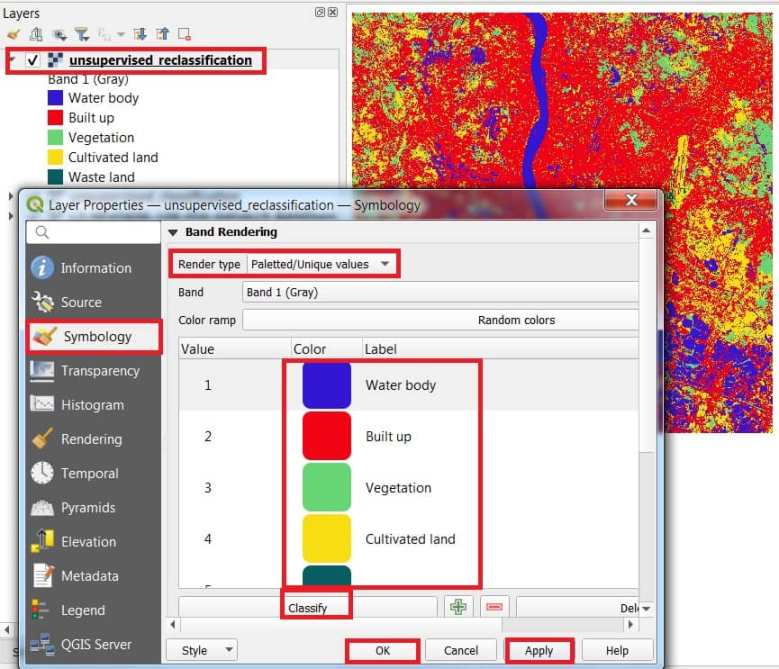
After all the process, the raster is added to the map. You can define a symbology according to classes.
1. In the Layer Properties, Symbology section, Choose Rander type- Paletted/Unique values, and click Classify.
2. Choose Color and Label, then click Apply > OK.