QGIS Tutorials
QGIS is a Free and Open Source Geographic Information System (GIS) Software.
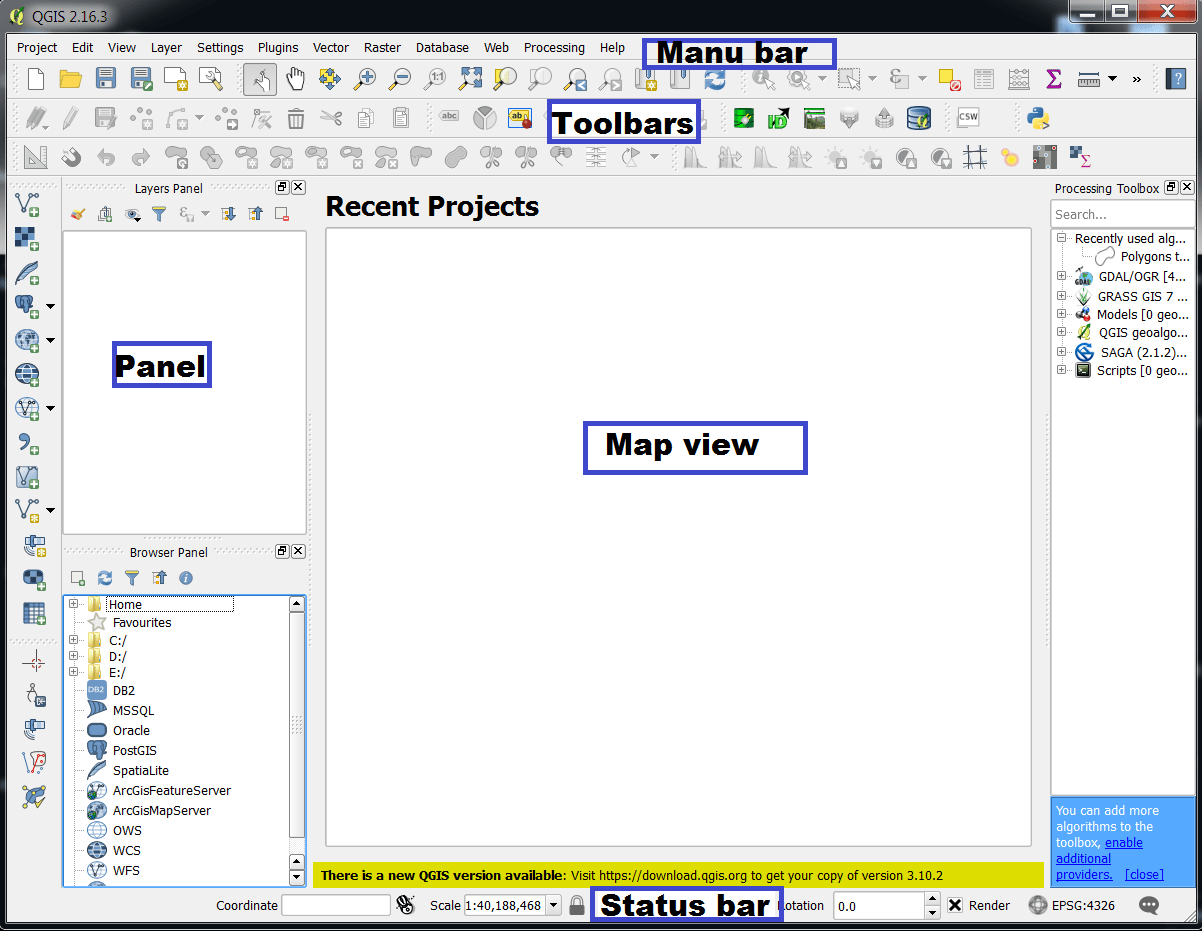
Download QGIS
The current version is 3.32.3 ‘Lima’ has been released. Download and study in below QGIS Tutorial Basic.
QGIS is available on Windows, macOS, Linux and Android.
QGIS Tutorial for Beginners
The QGIS GUI is divided into five areas:
- Manu bar
- Toolbars
- Panels
- Map view
- Status bar

Table of Contents
Perform Image to Image Georeferencing
In this QGIS Tutorial, Learn Image to Image Georeferencing.
First, open two Raster images (a) Referenced image, and (b) Unreferenced image.
Steps:
1. From the Layers panel, click Add Raster Layer tool.
In the Raster Data Source window, go to your folder, select the Referenced image, and click the open button.

2. Georeferencing in QGIS is done via the ‘Geereferencer GDAL’ plugin.
This is a core plugin- that means it is already part of your QGIS installation. You just need to enable it.
Go to Plugins > Manage and Install Plugins and enable the Georeferencer GDAL plugin in the installed tab.

3. The plugin is installed in the Raster menu.
Click on Raster > Georeferencer > Georeferencer to open the plugin.
The plugin window is divided into 2 sections. The top section where the Raster will be displayed and the bottom section where a table showing your GCP (Ground Control Point) values.


4. Now open the Unreferenced image in the Georeferencer plugin window.
Go to File > Open Raster, browse to your folder, select an Unreferenced image, and click Open.
5. In the next screen, you will be asked to choose the raster’s coordinate reference system (CRS). This is to specify the projection and datum of your control points.
Since WGS 84 (EPSG: 4326) is the most accurate CRS. Select it and click the OK button.
6. The image is loaded on the top section of the Georeferencer window. You can use the zoom/pan controls in the toolbar to learn more about the Unreferenced image.
Now you need to assign a control point somewhere on the Unreferenced image and also in the same location of the Referenced image. Click on Add Point in the toolbar.
7. Using the Add Point Tool, click on this Point on the Unreferenced image, then from the Enter Map Coordinates window. Click From Map Canvas button and click the same point on the Referenced image.

8. You notice the GCP Table now has a row with details of your first GCP.
Similarly, add another 3 GCPs covering the entire image. The more points you have, the more accurate your image is registered to the target coordinates.
9. Once you have enough points, go to Settings > Transformation settings.
In the transformation settings dialog open, choose the Transformation type > Thin Plate Spline, Resampling method > Nearest Neighbor, Target SRS (Spatial Reference System) > choose WGS 84 EPSG:4326.

The resulting image is in a widely compatible datum, Name your output raster. Make sure the Load QGIS when the done option is checked. Click OK.
10. Click the Start Georeferencing tool to finish the Georeferencing process.
11. Close the Georeference plugin window, this now asked you to save GCP points. Click the save button to save the GCP points.
12. In the QGIS primary interface, change the order of the layers in the Layers panel. An Unreferenced image should be placed on top of the Referenced image.
In the Layer Properties window, click the transparency menu and set global transparency 30%. Using zoom in and pan, Tool check how the referenced .tif image matches with the unreferenced image.
13. Save the project as georeferencing.assignment.
Perform Ground to Image Georeferencing
In this QGIS Tutorial Learn Ground to Image Georeferencing.
Steps:
1. Open QGIS Software, if it was not already opened, Click on Raster > Georeferencer > Georeferencer to open the plugin.
The plugin window is divided into 2 sections. The top section where the raster will be displayed and the bottom section where a table showing your GCP values.
2. Now open the Unreferenced image in Georeferencer window. Go to File > Open Raster, browse to your folder, select the Unreferenced image, and click open.
On the next screen, you will be asked to choose the raster’s coordinate reference system (CRS). This is to specify the projection and datum of your control points. If you are georeferencing a scanned map like this, you can obtain the- CRS information from the map itself.

3. Now you need to assign coordinates to some points on this map.
Zoom to this area of the image shown in the two cross-line sections, Click add point > and click the cross two-line middle point > in the pop-up window, input the coordinates values. Remember that X=Longitude and Y=Latitude.

4. Similarly, at least 4 GCPs covering the entire image. The more points you have, the more accurate your image is registered to the target coordinates.
You will notice the GCP table now has rows with details.
5. Once you have to collect enough points, go to Settings Transformation settings.
Follow the Transformation Process
6. Back in the Georeferencer window: go to File > Start Georeferencing. This will start the process of warping the image using the GCPs and creating the target raster.
Once the process finishes, you will see the georeferenced raster layer loaded in QGIS.
Change Projection (GCS to PCS)
In this QGIS Tutorial Learn How to change Projection.
1. Select the layer from the Layers panel. Click the right button, select Export and choose the Save As option.
2. In the Save vector layer as a window, choose Format ESRI Shapefile (i) > in the Save as a section.
Click the Browse button (ii) and go to your folder.
Write down the filename and click Save button > in select CRS section (iii).
Select your map or area which (ex. goa zone is- WGS 84 / UTM zone 43N) projection coordinate system Zone (PCS).
If you do not found the above coordinate system in the CRS window, then in the filter box write EPGS: WGS 84 / UTM zone 43N. QGIS finds the desired coordinate system and shows the bottom section of the CRS window.

3. Uncheck Add saved file to map checkbox (iv) > Click Ok button to close the Save vector layer as Window.

Notice change the coordinates – Move the cursor around the map. In the Status Bar, see how the coordinates change; coordinates for the map are provided based on the position of the cursor.

Create a Vector Data (Shapefile) in QGIS
In this QGIS Tutorial Learn How to Create Vector Data or Shapefile.
You’ll need to open the New Vector Layer dialog, that will allow you to define a new layer.
1. Navigate to and click on the menu entry Layer > create Layer > New Shapefile Layer.
2. It’s important to decide which kind of dataset you want at this stage. Basically, 3 different types of vector layer: (a) Point (b) Line (c) Polygon.
For Ex.- create a new Polygon dataset.

3. Click Polygon ratio button > Coordinate Reference System, or CRS.
The next field allows you to specify the specifies how to describe a point on Earth in terms of coordinates. There are many CRSs. The CRS of this project is WGS84.
It’s already correct by default > click ok a save dialog will appear > go to your destination folder > write name > click OK
Set Snapping
Go to the setting menu > Snapping option. In the Snapping Options window open > snapping mode– Advance > check on Layer > mode- to vartex and segment > Tolerance- 10.00000 > Unites –pixels > check on Avoid intersection.

Raster 2 Vector Conversion (screen Digitization)
Start the Digitization process in QGIS Tutorial.
1. To start digitization (Mexico boundary), click the Toggle Editing tool. on the Digitizing toolbar.

2. Click Add Feature tool on the Digitizing Toolbar and to begin digitizing right away.
You will notice that your mouse cursor has become a crosshair. This allows you to more accurately place the points you’ll be Digitizing.
3. Start digitizing by clicking on a point somewhere along the edge of the boundary.
4. Place more points by clicking further along the edge, until the shape you’re drawing completely covers the first boundary
5. To place your last point, right-click where you want it to be. This will finalize the feature and show you the Attributes. Fill in the values as below and Click OK, and you have created a new feature.
6. Click Save Layer edit tool to save the feature that you digitized.
7. Follow the above-mentioned step and digitize another boundary. When you digitize adjacent polygons, avoid intersections function in snapping windows to help you to do it. See the right side figure that helps you to perform the digitization of adjacent polygons.

8. To place your last point, right-click where you want it to be. This will finalize the feature and show you the Attributes dialog. Input ID value and click OK button.
9. Click Save Layer Edit tool to save the feature that you digitized. Click the Toggle Editing tool to stop the edit session.

Manipulate Features using Node tool
Start by activating the Node Tool and selecting a feature by clicking on it. Red boxes will appear at each vertex of this feature.

- Selecting vertices: You can select vertices by clicking on them one at a When a vertex is selected, its color changes to blue.
- Adding vertices: To add a vertex. simply double click near an edge and a new vertex will appear on the edge near to the cursor.
- Deleting vertices: Select the vertices and click the Delete key. To delete a complete feature, use the Delete Selected tool.
- Moving vertices: Select all the vertices you want to move, click on a selected vertex or edge and drag in the direction you wish to move. All the selected vertices will move, if snapping is enabled, the whole selection can jump to the reset vertex or line.
Change style and Transparency using Layer Properties
The Layer Properties dialog for a vector layer provides general settings to manage the appearance of layer features in the map (symbology, labeling, diagrams, etc.). It also provides information about the layer.
1. Double click you create a layer (Mexico boundary) in the Layers Panel or right-click > Properties, open layer properties window.
2. In Layer Properties window (see below figure), Click Style menu (i) from the left side panel, Click Simple fill option (ii). Then choose to fill color (iii) and Border color (iv) drop-down menu and select your preferred color, Border style(v) change Border width, and (vi) Set Layer transparency(vii).

3. Click Apply and ok button to close the layer properties window.
Save Project
QGIS can save the state of your workspace into a project file using.
Project menu > Save or Save As…, and go to your folder, save the project name. Whenever you save a project in QG1S, the project file is made with the extension .qgs.
Create Line and Point shapefile
1. Navigate to and click on the menu entry Layer > Create Layer > New Shapefile layer.
2. Choose types, what you want, Point(i), or Line(ii) > Specify the CRS WGS84 (WGS 84 is the default CRS)(iii).
By default, a new layer has only one attribute, the id field (which you should see in the Attributes list(iv) > Click OK, go to your folder, require one name and save.
3. Go to setting menu > Snapping option.

In the snapping Options window open > snapping mode- Advance > check on Layer > mode- to vartex and segment > Tolerance- 10.00000 > Unites- pixels > check on avoid intersection.
Perform Road Feature Digitization
Before starting digitization of Road features, if you see carefully the image, then you realize that some road features are adjacent to country boundaries.
So, how shall we digitize such features? The answer is using an enable tracing option present in Advanced Digitizing Toolbar.
1. Click View menu- Toolbars> Advanced Digitizing Toolbar.

2. To start digitization of Road features, select the road_map layer from the Layers panel.
3. Click the Toggle Editing button on the Digitizing Toolbar > Click Enable Tracing > Click Add Feature button on the Digitizing Toolbar and to begin digitizing right away.

4. Trace boundary, digitize individual road segment, and input id.
5. Road features that are not adjacent to the boundary to be digitized in a normal way (click Enable tracing tool to make it off).
6. Click the Seve Layer Edits tool to save the feature that you digitized. Click the Toggle Editing tool, stop the edit session.
View attributes and changes feature a style of the road layer if you want in the same way mentioned earlier. Don’t forget Save your project.
Perform Point Feature Digitization
1. To start digitization of the point feature, select the point layer from the Layers panel.
Click the Toggle Editing button on the Digitizing Toolbar > click Add Feature button on the Digitizing Toolbar and to begin digitizing right away. Digitize all the point features and input their respective IDs.

2. Click Save layer edit tool to save the feature that you digitized. Click the Toggle editing tool to stop the edit session.
Convert Excel to GIS data using Spreadsheet Layers plugin
In this QGIS Tutorial Learn How to use Spreadsheet plugin in QGIS.
Installation of Spreadsheet Layers Plugin-
1. Click on Plugins menu, then Manage an Install Plugins.

2. In the Plugins window, click All (i) in the left panel > Type Spreadsheet in the search box (ii) > then select Spreadsheet Layers plugin (iii) from the below window and click Install plugin button (iv) > click the close button to the close window.

3. Click Add spreadsheet layer tool from the Manage Layers toolbar. Then create a layer from a spreadsheet file window open.

4. Click Browse button (i) > Go to your folder, select and open xlsx file(EXCEL FILE) > have multiple sheets. Select sheet (ii) > write Layer name (iii).
Finally, click the Ok button to close the Create a layer from a spreadsheet file window.
5. Now see, add to Excel data file your QGIS layer panel.
Join Data with Shapefile
1. Select layer from the Layers panel, click the right button, choose Properties.
2. In the Layer Properties window, from the left-hand-side panel, click Joins (i) > Click Add vector join button (ii).
Then Add vector join window appears > in the Add vector join window, choose Join layer “goa_district”(iii), Join field “goa-id”(iv) and Target field “id”(v).
Check Custom field name prefix box and make empty the below text box (vi), > Click Ok button to close the Add vector join window.
Click Apply and Ok button to close the Layer Properties window.

Now open the Attribute table for ‘a‘ layer to see the appended fields of a table with the help of two common fields. Such as ‘id’ and ‘Goa-id’, present in .xlsx and goa shapefile respectively.
Remember that table join is not permanent, only saved temporarily within the project (.qgs) file. Now save your project immediately.
Uses Attributes Toolbar

QGIS can measure real distances between given points. The tool then allows you to click points on the map.
Used to Identify tools to identify any feature.
This reveals the select you’ve selected in the Map View. These two steps demonstrate that the table and feature are linked, and you can select features in one or display than in the other.
Click the Deselect feature, unselect or clear all features.
The Attribute Table is a Database of your project.
Expression Feature used to solve any kind of query
- Field Calculator (calculate Area)–
Calculator window, which allows you to calculate the field based on attribute expression.
Label and style for Vector Layer
Label Features
Labeling is an easy way to add descriptive text to point, line, and polygon features on your map. Labels are dynamically placed, and label text strings are based on feature attributes.
1. Add Label Toolbar (if not already visible in your QGIS application) by going to View menu > Toolbars > Label Toolbar.
2. Select the layer from the Layers Panel > right click > properties > Click Labels options tool > Label settings window open > place no labels drop-down, select-Show labels for this layer (i) > select Label with (ii) > and all settings as for you choose(font,style,size,etc (iii). All settings is complited click Apply and Ok.

Style Features
The Style feature in QGIS provides you with a comprehensive tool for rendering a symbolizing your vector data. You can use tools that are common to all vector data. Special symbolizing tools that were designed for the different kinds of vector data.
1. Select the layer from the Layers Panel, right-click, and select In the Layer Properties window, select the style menu from the left side. 3 types of symbols used to Vector layer (i) Single symbol (use to the normal background color in features), (ii) Categorized (use to multiple colors in features), (iii) Graduate (used to show low to a high value in the same color, for ex. Population Density).
Layout (Print composer)
In this QGIS Tutorial, Learn How to Layout in QGIS.
Layout Features
Text labels, legends, scale bars, basic shapes, arrows, attribute tables, and HTML frames. You can size, group, align, position, and rotate each element and adjust their properties to create your layout.
Uses all toolbars to-add Map, Image, Scale-bar, Legend, North line, Table, Move, Position, etc.

Using Grids for showing Coordinates value.

Uses Item properties to proper Text, Font, Size, Symbol, Color, Border, Background, Rotation, etc.

Add Coordinate value (Latitude & Longitude)- go to item properties > select Grids > + > choose Grid Type > change CRS (WGS 84 EPGS 4326) > select the Interval value X & Y (it is varied to map scale) > choose Grid frame style > select Draw Coordinate check box > settings Format, left, right, top, button, font, etc.
Complete the Layout it’s save as (export) Image, SVG or PDF Format


Learn more QGIS Tutorials
Importing Spreadsheets or xlsx files and Join Data
Importing Spreadsheets or xlex file and Join Data – QGIS…
Terrain Analysis
Terrain Analysis- QGIS Terrain Analysis is the interpretation of topographic features…
Attributes Toolbar in QGIS
Uses Attributes Toolbar – QGIS In this Tutorial, Learn use…
Heatmap – QGIS
Heatmap – QGIS Heatmap is an interpolation technique useful in…