Image Enhancement in Remote Sensing
Image enhancement is the process of making an image more interpret-able for a particular application (Faust, 1989).
Enhancement makes important features of raw, remotely sensed data more interpret-able to the human eye.
The techniques to be used in image enhancement depend upon:
- The different bands of Landsat, SPOT, and other imaging sensors are selected to detect certain features. You must know the parameters of the bands being used before performing any enhancement.
- Your objective, like sharpening an image to identify features that can be used for training samples, requires a different set of enhancement techniques than reducing the number of bands in the study.
- Your expectations- what you think you are going to find.
Satellite Image Enhancement Techniques
Radiometric Enhancement
Radiometric enhancement deals with the individual values of the pixels in the image. It differs from spatial enhancement, which takes into account the values of neighboring pixels.
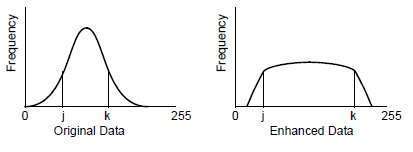
The range between j and k in the histogram of the original data is about one third of the total range of the data. The pixels between j and k gain contrast-it is easier to distinguish different brightness values in these pixels.
Contrast Stretching
Contrast enhancement (image stretching) is a widely applicable standard image processing technique. However, even adjustable stretches, like the piecewise linear stretch, act on the scene globally. There are many circumstances where this is not the optimum approach.
When radiometric enhancements are performed on the display device, the transformation of data file values into brightness values is illustrated by the graph of a lookup table.
Increases the contrast of data file values in the middle range of the input data. The input range within the bracket is narrow, but the output brightness values for the same pixels are stretched over a wider range. This process is called contrast stretching.
Histogram Equalization
The Histogram equalization is a nonlinear stretch that redistributes pixel values so that there is approximately the same number of pixels with each value within a range. The result approximates a flat histogram. Therefore, contrast is increased at the peaks of the histogram and lessened at the tails.
Histogram Matching
Histogram matching is the process of determining a lookup table that converts the histogram of one image to resemble the histogram of another. It is matching is useful for matching data of the same or adjacent scenes that were scanned on separate days, or are slightly different because of sun angle or atmospheric effects. This is especially useful for mosaic-king or change detection.
Brightness Inversion
The brightness inversion functions produce images that have the opposite contrast to the original image. Dark detail becomes light, and light detail becomes dark. This can also be used to invert a negative image that has been scanned to produce a positive image. Brightness inversion has two options: inverse and reverse.
Spatial Enhancement
While radiometric enhancements operate on each pixel individually, spatial enhancement modifies pixel values based on the values of the surrounding pixels.
Spatial enhancement deals largely with spatial frequency, which is the difference between the highest and lowest values of a contiguous set of pixels. Jensen (Jensen, 1986) defines spatial frequency as “the number of changes in brightness value per unit distance for any particular part of an image”.
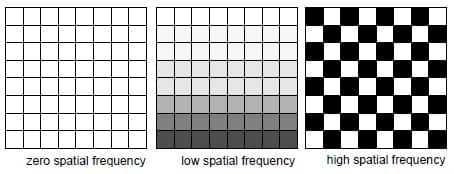
- Zero spatial frequency—a flat image in which every pixel has the same value
- Low spatial frequency—an image consisting of a smoothly varying gray scale
- Highest spatial frequency—an image consisting of a checkerboard of black and white pixels
Convolution Filtering
The Convolution filtering is the process of averaging small sets of pixels across an image. Convolution filtering is used to change the spatial frequency characteristics of an image (Jensen, 1996).
Crisp
Crisp filter sharpens the overall scene luminance without distorting the inter-band variance content of the image. This is a useful enhancement if the image is blurred due to atmospheric haze, rapid sensor motion, or a broad point spread function of the sensor.
Resolution Merge
The resolution of a specific sensor can refer to Radiometric, Spatial, Spectral, or Temporal resolution.
Landsat TM sensors have seven bands with a spatial resolution of 28.5 m. SPOT panchromatic has one broad band with very good spatial resolution-10 m. Combining these two images to yield a seven-band data set with 10 m resolution provides the best characteristics of both sensors.
Adaptive Filter
Coastal studies where much of the water detail is spread through a very low DN range and the land detail is spread through a much higher DN range would be such a circumstance. In these cases, a filter that adapts the stretch to the region of interest would produce a better enhancement.
Adaptively filtered can be divided into three broad and overlapping categories: Undegraded, Low luminance, and High luminance.
Spectral Enhancement
The Spectral enhancement techniques that follow require more than one band of data.
They can be used to:
- Compress bands of data that are similar
- Extract new bands of data that are more interpretable to the eye
- Apply mathematical transforms and algorithms
- Display a wider variety of information in the three available color guns (R, G, B)
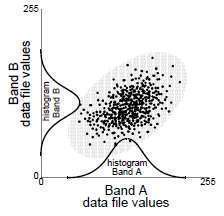
The process is easily explained graphically with an example of data in two bands. The two band scatterplot, which shows the relationships of data file values in two bands. The values of one band are plotted against those of the other. If both bands have normal distributions, an ellipse shape results.
Principal Components Analysis
Principal components analysis (PCA) is often used as a method of data compression. It allows redundant data to be compacted into fewer bands- that is, the dimensional of the data is reduced. The bands of PCA data are non-correlated and independent, and are often more interpret-able than the source data (Jensen, 1996; Faust, 1989).
De-correlation Stretch
The de-correlation stretch stretches the principal components of an image, not to the original image.
The purpose of a contrast stretch is to:
- Alter the distribution of the image DN values within the 0–255 range of the display device
- Utilize the full range of values in a linear fashion.
Tasseled Cap
The different bands in a multi-spectral image can be visualized as defining an N-dimensional space where N is the number of bands. Each pixel, positioned according to its DN value in each band, lies within the N-dimensional space. This pixel distribution is determined by the absorption/reflection spectra of the imaged material. This clustering of the pixels is termed the data structure (Crist and Kauth, 1986).
RGB to IHS
The color monitors used for image display on image processing systems have three color filters or guns. These correspond to red, green, and blue (R, G, B), the additive primary colors. When displaying three bands of a multi-band data set, the viewer image is said to be in R, G, B space.
However, it is possible to define an alternate color space that uses intensity (I), hue (H), and saturation (S) as the three positioned parameters (in lieu of R,G, B). This system is advantageous in that it presents colors more nearly as perceived by the human eye.
IHS to RGB
In the IHS to RGB algorithm, a min-max stretch applied to either intensity (I), saturation (S), or both, so that they more fully utilize the 0 to 1 value range. The values for hue (H), a circular dimension, are 0 to 360.
However, depending on the dynamic range of the DN values of the input image, it is possible that I or S or both occupy only a part of the 0 to 1 range. In this model, a min-max stretch is applied to either I, S, or both, so that they more fully utilize the 0 to 1 value range.
After stretching, the full IHS image is re-transformed back to the original RGB space. As the parameter Hue is not changed, it largely defines what we perceive as color, and the resultant image looks very much like the input image.
Indices
Indices are used to create output images by mathematically combining the DN values of different bands. These may be simplistic: – (Brand X–Band Y).
These ratio images are derived from the absorption/reflection spectra of the material of interest. The absorption is based on the molecular bonds in the material. Thus, the ratio often gives information on the chemical composition of the target.