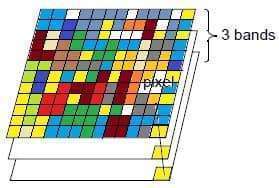
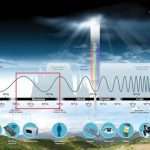
Band Combination in Remote Sensing In Remote Sensing Electromagnetic spectrum emitted heat . There are several bands including; red, green, blue, near-infrared, thermal infrared
The bands of data are occasionally referred to as layers. Once a band is imported into a GIS
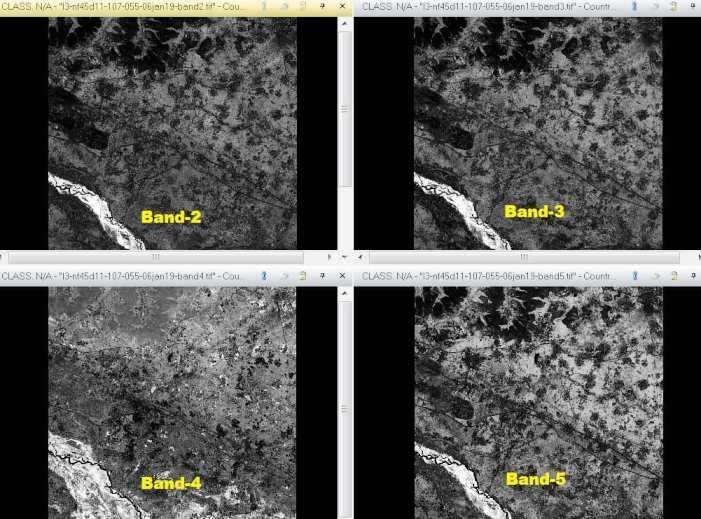
Band combination are used to highlight the presence of certain land features. The most common band combination in Remote Sensing is False Color, that is Red, Green, Blue (RGB- 4,3,2), its call FCC
Spectal Band Combination Types:
Combination Name Band 1 Band 2 Band 3 Natural Color Red Green Blue Urban False Color SWIR22 SWIR16 Red Vegetation Analysis SWIR16 NIR Red Healthy Vegetation NIR SWIR16 Blue Land/Water NIR SWIR16 Red Agriculture NIR Red Green Atmospheric Penetration SWIR22 SWIR16 NIR Natural With Atmospheric Removal SWIR22 NIR Green
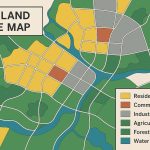
[NIR – Near-infrared, SWIR – Short Wave Infrared] Land Cover Type Spectral Band Combination Water Band 1, 4 & 7 / Band 1, 2 & 3 Urban Band 1,4 & 7 Farmland Band 1, 2 & 3 Forest Band 1, 4 & 7 Salt Scald Band 1, 2 & 3 Remnant Vegetation Band 1, 4 & 7 Irrigated Vegetation Band 1, 4 & 7
Landsat 1-5 Bands (MSS)1-3 Bands 4-5 Bands Wavelength Resolution Band 4 Band 1 0.5-0.6 60 Band 5 Band 2 0.6-0.7 60 Band 6 Band 3 0.7-0.8 60 Band 7 Band 4 0.8-1.1 60
Landsat 4 and 5 Bands (TM)Bands Wavelength [micrometers] Resolution [meters] Band 1 – Blue 0.45 – 0.52 30 Band 2 – Green 0.52 – 0.60 30 Band 3 – Red 0.63 – 0.69 30 Band 4 – Near Infrared (NIR) 0.76 – 0.90 30 Band 5 – SWIR 1.55 – 1.75 30 Band 6 – Thermal Infrared 10.40 – 12.50 120 Band 7 – SWIR 2.08 – 2.35 30
Landsat 7 Bands ETM+) Bands Wavelength [micrometers] Resolution [meters] Band 1 – Blue 0.45 – 0.52 30 Band 2 – Green 0.52 – 0.60 30 Band 3 – Red 0.63 – 0.69 30 Band 4 – Near Infrared (NIR) 0.77 – 0.90 30 Band 5 – SWIR 1.57 – 1.75 30 Band 6 – Thermal Infrared 10.40 – 12.50 60 Band 7 – SWIR 2.09 – 2.35 30 Band 8 – Panchromatic 0.52 – 0.90 15
Landsat 8 Bands Bands Wavelength [micrometers] Resolution [meters] Band 1 – Coastal aerosol 0.43 – 0.45 30 Band 2 – Blue 0.45 – 0.51 30 Band 3 – Green 0.53 – 0.59 30 Band 4 – Red 0.64 – 0.67 30 Band 5 – Near Infrared (NIR) 0.85 – 0.88 30 Band 6 – SWIR 1 1.57 – 1.65 30 Band 7 – SWIR 2 2.11 – 2.29 30 Band 8 – Panchromatic 0.50 – 0.68 15 Band 9 – Cirrus 1.36 – 1.38 30 Band 10 – Thermal Infrared (TIR) 1 10.60 – 11.19 100 Band 11 – Thermal Infrared (TIR) 2 11.50 – 12.51 100
[Note TM – Thematic Mapper, MSS – Multispectral Scanner, ETM – Enhanced Thematic Mapper, SWIR – Short wave Infrared]
Band Name Band Range (μm) Landsat 5 Landsat 7 Landsat 8 Sentinel 2 Coastal 0.40 – 0.45 1 1 Blue 0.45 – 0.5 1 1 2 2 Green 0.5 – 0.6 2 2 3 3 Red 0.6 – 0.7 3 3 4 4 Pan 0.5 – 0.7 8 8 NIR 0.77 – 1.00 4 4 5 8 Cirrus 1.35 – 1.40 9 10 SWIR16 1.55 – 1.75 5 5 6 11 SWIR22 2.1 – 2.3 7 7 7 12 LWIR 10.5 – 12.5 6 6 10, 11
[μm – micrometers] Sentinel-2 Band CombinationsBands Wavelength [micrometers] Resolution [meters] Band 1 – Coastal aerosol 0.443 60 Band 2 – Blue 0.490 10 Band 3 – Green 0.560 10 Band 4 – Red 0.665 10 Band 5 – Vegetation Red Edge 0.705 20 Band 6 – Vegetation Red Edge 0.740 20 Band 7 – Vegetation Red Edge 0.783 20 Band 8 – NIR 0.842 10 Band 8A – Vegetation Red Edge 0.865 20 Band 9 – Water vapour 0.945 60 Band 10 – SWIR – Cirrus 1.375 60 Band 11 – SWIR 1.610 20 Band 12 – SWIR 2.190 20
Bands Wavelength [micrometers] Resolution [meters] Band 1 – Green 0.52 – 0.60 15 Band 2 – Red 0.63 – 0.69 15 Band 3N – Near Infrared (NIR) 0.78 – 0.86 15 Band 4 – SWIR 1 1.60 – 1.70 30 Band 5 – SWIR 2 2.145 – 2.185 30 Band 6 – SWIR 3 2.185 – 2.225 30 Band 7 – SWIR 4 2.235 – 2.285 30 Band 8 – SWIR 5 2.295 – 2.365 30 Band 9 – SWIR 6 2.360 – 2.430 30 Band 10 – TIR 1 8.125 – 8.475 90 Band 11 – TIR 2 8.475 – 8.825 90 Band 12 – TIR 3 8.925 – 9.275 90 Band 13 – TIR 4 10.25 – 10.95 90 Band 14 – TIR 5 10.95 – 11.65 90
Bands Wavelength [micrometers] Resolution [meters] 1, Blue – 2, Green 0.52 to 0.59 23 3, Red 0.62 to 0.68 23 4, NIR 0.77 to 0.86 23 5, SWIR 1.55 to 1.70 70

I every time used to study post in news papers but now as I am a user of net thus from now I am using net for articles, thanks to web.