Satellite Systems: Components, Types, Satellites
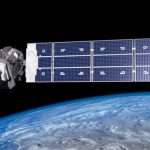
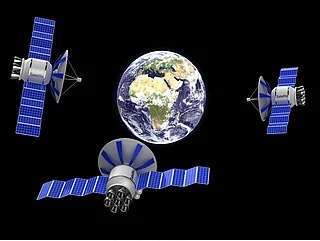
A satellite system refers to a group of components that work together to operate a satellite in space. These systems are designed for various purposes such as communication, earth observation, navigation, scientific research, and military applications.
Satellite system is composed of a scanner with sensors and a satellite platform. Sensors are made up of Detectors. The total width of the area on the ground covered by the scanner is called swath, or field of view (FOV).
Main Components of a Satellite System
1. Space Segment (Satellite)
- Payload: The mission-specific equipment (e.g., camera, sensors, transponders).
- Bus (Platform): Supports the payload and includes subsystems such as:
- Power System (solar panels, batteries)
- Attitude and Orbit Control System (AOCS)
- Thermal Control System
- Command and Data Handling System
- Communication System
2. Ground Segment
- Ground Stations: Track and communicate with satellites.
- Mission Control Center: Operates and monitors the satellite.
- Data Processing Centers: Analyze and distribute collected data.
3. Launch Segment
- Includes launch vehicle (rocket) and related infrastructure.
- Responsible for placing the satellite into its designated orbit.

Types of Satellite Systems by Function
| Type | Purpose |
|---|---|
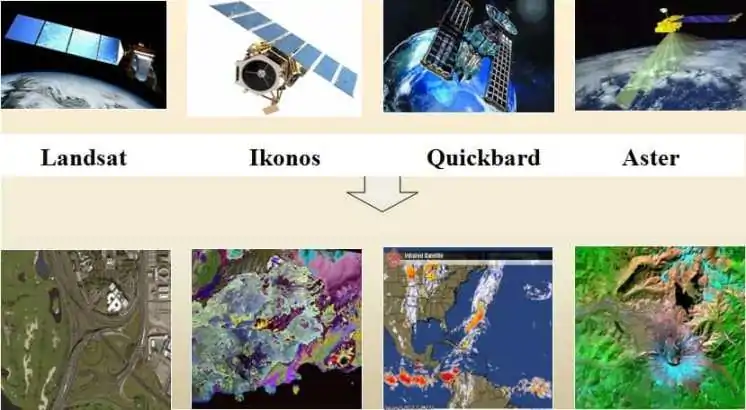
| Earth Observation | Monitor Earth’s surface, weather, land use (e.g., Landsat, Sentinel) |
| Communication | Provide TV, internet, and phone services (e.g., INSAT, Starlink) |
| Navigation | GPS, GLONASS, Galileo for positioning and timing |
| Scientific | Space research, astrophysics (e.g., Hubble, James Webb) |
| Military/Defense | Surveillance, secure communication |
Types of Orbits Used
- LEO (Low Earth Orbit): 200–2,000 km, used for earth observation.
- MEO (Medium Earth Orbit): 2,000–35,000 km, used for GPS.
- GEO (Geostationary Orbit): ~35,786 km, used for communication and weather satellites.
- SSO (Sun-Synchronous Orbit): A type of LEO ideal for consistent lighting conditions in imaging.
Satellites
Landsat and SPOT satellites are two important date acquisition satellites, also discuss other important satellites in below.
Landsat
Landsat 1-5 Satellite System
In 1972, National Aeronautics and Space Administration (NASA) initiated the first civilian program specializing in the acquisition of remotely sensed digital satellite data. The first system was called ERTS (Earth Resources Technology Satellites), and later renamed to Landsat. There have been several Landsat satellites launched in 1972. Landsats 1, 2, 3 and 4 are no longer operating. US Geological Survey Flight Operations Team completed decommission of Landsat 5 in June 2013.
Landsat 1, 2, and 3 gathered Multispectral Scanner (MSS) data and Landsats 4 and 5 collected MSS and Thematic Mapper (TM) data.
Landsat MSS
Multispectral Scanner from Landsats 4 and 5 had a swath width of approximately 185 × 170 km from a height of approximately 900 km for Landsats 1, 2, and 3, and 705 km for Landsats 4 and 5. MSS data are widely used for general geologic studies as well as vegetation inventories.
Spatial resolution of MSS data is 56 × 79 m, with a 79 × 79 m IFOV. A typical scene contains approximately 2340 rows and 3240 columns. Radiometric resolution is 6-bit, but it is stored as 8-bit.
Landsat MSS Band Composition
| Band | Wavelength (micrometres) | Uses |
|---|---|---|
| 1, Green | 0.50 to 0.60 | Scans the region between blue and red chlorophyll absorption bands. Green reflectance of healthy vegetation. Map water bodies. |
| 2, Red | 0.60 to 0.70 | Red chlorophyll absorption band of healthy green vegetation. Identify vegetation types. Determine soil boundary and geological boundary delineations Cultural features. |
| 3, Red, NIR | 0.70 to 0.80 | dentify crops. Identify soil and crop boundaries. Identify land and water boundaries. |
| 4, NIR | 0.80 to 1.10 | Vegetation surveys Penetrates atmospheric haze |
Landsat TM
TM had a swath width of approximately 185 km from a height of approximately 705 km. It is useful for vegetation type and health determination, soil moisture snow and cloud differentiation, rock type discrimination, and so forth.
Spatial resolution of TM is 28.5 × 28.5 m for all bands except the thermal (band 6), which has a spatial resolution of 120 × 120 m. The larger pixel size of this band is necessary for adequate signal strength. However, the thermal band is resampled to 28.5 × 28.5 m to match the other bands. Radiometric resolution is 8-bit, meaning that each pixel has a possible range of data values from 0 to 255.
Landsat TM Band Composition
| Band | Wavelength (micrometres) | Uses |
|---|---|---|
| 1, Blue | 0.45 to 0.52 | Coastal water area mapping. Differentiate between soil and vegetation. Forest type mapping. Detect cultural features. |
| 2, Green | 0.52 to 0.60 | Green reflectance of healthy vegetation. Identify cultural features. |
| 3, Red | 0.63 to 0.69 | Differentiate between many plant species. Determine soil boundary and geological boundaries. Identify cultural features. |
| 4, NIR | 0.76 to 0.90 | Determine amount of vegetation biomass. Identify crops. Determine soil and crop boundaries. Determine land and water boundaries. |
| 5, MIR | 1.55 to 1.75 | Measure moisture content in plants for crop drought studies and plant health analysis. Differentiate between clouds, snow, and ice. |
| 6, TIR | 10.40 to 12.50 | Detect stress in vegetation and crops. Measure heat intensity. Determine insecticide applications. Locate thermal pollution. Locate geothermal activity. |
| 7, MIR | 2.08 to 2.35 | Determine boundaries of geologic rock type and soil. Measure soil and vegetation moisture content. |
Landsat 7 Satellite System
Landsat 7 satellite, launched in 1999, uses Enhanced Thematic Mapper Plus
(ETM+) to observe the Earth. Capabilities new to Landsat 7 following:
• 15m spatial resolution panchromatic band
• 5% radiometric calibration with full aperture
• 60m spatial resolution thermal IR channel
Landsat 7 Band Composition
| Band | Wavelength (micrometres) | Resolution (m) |
|---|---|---|
| 1 | 0.45 to 0.52 | 30 |
| 2 | 0.52 to 0.60 | 30 |
| 3 | 0.63 to 0.69 | 30 |
| 4 | 0.76 to 0.90 | 30 |
| 5 | 1.55 to 1.75 | 30 |
| 6 | 10.4 to 12.5 | 60 |
| 7 | 2.08 to 2.35 | 30 |
| 8 (Panchromatic) | 0.50 to 0.90 | 15 |
SPOT
SPOT 1 – 3 Satellite System
SPOT 1 satellite was developed by French Centre National d’Etudes Spatiales (CNES), launched in 1986, and deorbited in 2003. SPOT 2 satellite, launched in 1990 and deorbited in 2009, was the first in the series to carry the DORIS precision positioning instrument. SPOT 3, launched in 1993, also carried the DORIS instrument, plus the American passenger payload POAM II, used to measure atmospheric ozone at the poles. SPOT 3 was decommissioned in 1996.
SPOT Panchromatic
SPOT Panchromatic (meaning sensitive to all visible colors) has 10 × 10 m spatial resolution, contains 1 band—510 to 730 nm—and is similar to a black and white photograph. It has a radiometric resolution of 8 bits.
SPOT MSS/XS
SPOT XS, or multispectral, has 20 × 20 m spatial resolution, 8-bit radiometric resolution, and contains 3 bands.
SPOT MSS Band Composition
| Band | Wavelength (micrometres) | Uses |
|---|---|---|
| 1, Green | 0.50 to 0.59 | Green reflectance of healthy vegetation. |
| 2, Red | 0.61 to 0.68 | Discriminates between plant species. Soil boundary and geological boundary delineations. |
| 3, Reflective IR | 0.79 to 0.89 | Measures amount of vegetation biomass present in a scene. Crop identification. Emphasizes contrasts between soil and crop, land and water. |
SPOT 4 Satellite System
SPOT 4 satellite was launched in 1998. SPOT 4 carries High Resolution Visible Infrared (HR VIR) instruments that obtain information in the visible and near-infrared spectral bands.
SPOT 4 satellite orbits the Earth at 822 km at the Equator. It has 2 sensors on board: i) Multispectral sensor, and ii) Panchromatic sensor.
The multispectral scanner has a pixel size of 20 × 20 m, and a swath width of 60 km. The panchromatic scanner has a pixel size of 10 × 10 m, and a swath width of 60 km.
SPOT 4 Band Composition
| Band | Wavelength (nanometer) |
|---|---|
| 1, Green | 500 to 590 nm |
| 2, Red | 610 to 680 nm |
| 3, (near-IR) | 780 to 890 nm |
| 4, (mid-IR) | 1580 to 1750 nm |
| Panchromatic | 610 to 680 nm |
SPOT 5 Satellite System
SPOT 5 satellite, launched in 2002, carries two new HRVIR viewing instruments which have a better resolution: 2.5 to 5 meters in panchromatic and infrared mode and 10 meters in multispectral mode.
IRS-1C, IRS-1D
IRS-1C satellite, developed by Indian Space Research Organisation, waslaunched in December 1995. ISRO announced mission complete in September 2007.
IRS-1D, launched in September 1997, was developed by Indian Space Research Organisation.(ISRO). ISRO announced mission complete in January 2010.
LISS-III
LISS-III had spatial resolution of 23 m, with the exception of the SW Infrared band, which was 70 m. Bands 2, 3, and 4 had swath width of 142 kilometers; band 5 had swath width of 148 km.
LISS-III Band Composition
| Band | Wavelength (micrometres) |
|---|---|
| 1, Blue | – |
| 2, Green | 0.52 to 0.59 |
| 3, Red | 0.62 to 0.68 |
| 4, NIR | 0.77 to 0.86 |
| 5, SWIR | 1.55 to 1.70 |
IRS Panchromatic Sensor
The panchromatic sensor had 5.8 m spatial resolution, as well as stereo capability. Its swath width is 70 m. Revisit time was every five days, with ± 26 off-nadir viewing.
Panchromatic Band Composition
| Band | Wavelength (micrometres) |
|---|---|
| Pan | 0.5 to 0.75 |
Wide Field Sensor (WiFS)
WiFS had 188 m spatial resolution, and repeat coverage every five days at the Equator. Swath width was 774 km.
WiFS Band Composition
| Band | Wavelength (micrometres) |
|---|---|
| 1, Red | 0.62 to 0.68 |
| 2, NIR | 0.77 to 0.86 |
| 3, MIR | 1.55 to 1.75 |
ASTER
ASTER (Advanced Spaceborne Thermal Emission and Reflection Radiometer) is an instrument flying on Terra, a satellite launched in December 1999 as part of NASA’s Earth Observing System (EOS). Compared with Landsat Thematic Mapper and Japan’s JERS-1 OPS scanner, ASTER instrument is the next generation in remote sensing imaging.
ASTER captures high resolution data in the visible to thermal infrared wavelength spectrum and provides stereo viewing capability for DEM creation.
ASTER instrument consists of 3 subsystems:
- Visible and Near Infrared(VNIR)
- Shortwave Infrared (SWIR)
- Thermal Infrared (TIR).
ASTER Sensor Characteristics
| Characterisic | VNIR | SWIR | TIR |
|---|---|---|---|
| Spectral Range Wavelengths in micrometres | Band 1 0.52 – 0.60 | Band 4 1.68 – 1.70 | Band 10 8.125 – 8.475 |
| Band 2 0.63 – 0.69 | Band 5 2.145 – 2.185 | Band 11 8.475 – 8.825 | |
| Band 3 0.76 – 0.86 | Band 6 2.185 – 2.225 | Band 12 8/925 – 9.275 | |
| Band 3 0.76 – 0.86 | Band 7 2.235 – 2.285 | Band 13 10.25 – 10.95 | |
| Band 8 2.295 – 2.365 | Band 14 10.95 – 11.65 | ||
| Band 9 2.360 – 2.430 | |||
| Ground Resolution | 15 m | 30 m | 90 m |
| Swath Width | 60 km | 60 km | 60 km |
IKONOS
IKONOS satellite was launched in September 1999. IKONOS panchromatic sensor resolution is 1 m, and multispectral scanner resolution is 4 m. The swath width is 13 km at nadir. Accuracy with out ground control is 12 m horizontally, and 10 m vertically; with ground control it is 2 m horizontally, and 3 m vertically.
IKONOS orbits at an altitude of 423 miles, or 681 kilometers. Revisit time is 2.9 days at 1 m resolution, and 1.5 days at 1.5 m resolution.
IKONOS Band Composition
| Band | Wavelength (micrometres) |
|---|---|
| 1, Blue | 0.45 to 0.52 |
| 2, Green | 0.52 to 0.60 |
| 3, Red | 0.63 to 0.69 |
| 4, NIR | 0.76 to 0.90 |
| Panchromatic | 0.45 to 0.90 |
QuickBird
QuickBird satellite was launched in 2001, by Digital Globe offering imagery for map publishing, land and asset management, change detection and insurance risk assessment.
QuickBird produces sub-meter resolution panchromatic and multispectral imagery. The data collection nominal swath width is 16.5 km at nadir, and areas of interest sizes are 16.5 km x 16.5 km for a single area and 16.5 km x 115 km for a strip.
QuickBird Satellite Characteristics
| Geometry of orbit | sun-synchronous |
| Orbit Altitude | 450 km |
| Orbit Inclination | 98 degrees |
| Swath Width | normal – 16.5 km at nadir accessible ground – 544 km centered on the satellite ground track |
| Sensor Resolution ground sample distance at nadir | panchromatic – 61 cm (2 feet) multispectral – 2.4 m (8 feet) |
| Spectral Bandwidth Panchromatic | 445 to 900 nm |
| Spectral Bandwidth Multispectral | 450 – 520 nm (blue) 520 – 600 nm (green) 630 – 690 nm (red) 760 – 900 (near infrared) |