Raster Analysis in QGIS
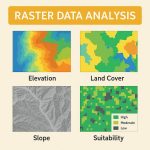
In QGIS raster allow you to gain more insight into the terrain that they represent.
In this lesson you will use terrain analysis tools to find out more about the study area for the proposed residential development.
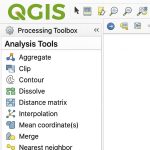
Open all the Raster analysis tool in QGIS.
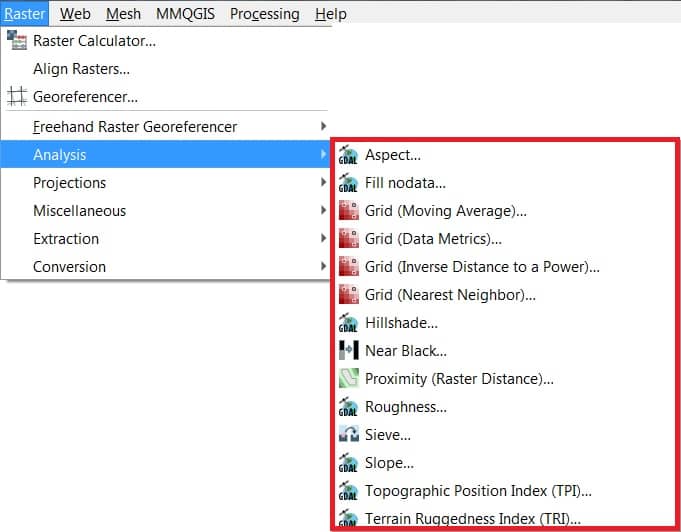
In the Toolbar menu, click on Raster, select Analysis, and see all the available terrain analysis tools.
| Sl No. | Tool | Purpose |
|---|---|---|
| 1 | Aspect | Aspect is the compass direction that a slope faces. The pixels will have a value from 0-360° measured in degrees from north indicating the azimuth. |
| 2 | Fill nodata | Fill raster regions with no data values by interpolation from edges. The values for the no-data regions are calculated by the sourrounding pixel values using inverse distance weighting. After the interpolation a smoothing of the results takes placce. |
| 3 | Grid (Moving average) | he Moving Average is a simple data averaging algorithm. It uses a moving window of elliptic form to search values and averages all data points within the window. |
| 4 | Grid (Data metrics) | Computes some data metrics using the specified window and output grid geometry. |
| 5 | Grid (Inverse distance to a power) | The Inverse Distance to a Power gridding method is a weighted average interpolator. |
| 6 | Grid (Nearest neighbor) | The Nearest Neighbor method doesn’t perform any interpolation or smoothing, it just takes the value of nearest point found in grid node search ellipse and returns it as a result. |
| 7 | Hillshade | The Hillshade very useful for visualizing the terrain. Outputs a raster with a nice shaded relief effect. |
| 8 | Near black | Converts nearly black/white borders to black. |
| 9 | Proximity (raster distance) | Generates a raster proximity map indicating the distance from the center of each pixel to the center of the nearest pixel identified as a target pixel. |
| 10 | Roughness | Roughness is the degree of irregularity of the surface. It’s calculated by the largest inter-cell difference of a central pixel and its surrounding cell. |
| 11 | Sieve | Removes raster polygons smaller than a provided threshold size and replaces them with the pixel value of the largest neighbour polygon. |
| 12 | Slope | Slope is the angle of inclination to the horizontal. You have the option of specifying the type of slope value you want: degrees or percent slope. |
| 13 | Terrain Ruggedness Index (TRI) | TRI stands for Terrain Ruggedness Index, which is defined as the mean difference between a central pixel and its surrounding cells. |
| 14 | Topographic Position Index (TPI) | TPI stands for Topographic Position Index, which is defined as the difference between a central pixel and the mean of its surrounding cells. |