Classification Accuracy Assessment Using QGIS
In this tutorial learn, how to perform the accuracy assessment of a land cover classification using the Semi–Automatic Classification Plugin (SCP) for QGIS.
Accuracy assessment is a fundamental step after land cover classification in order to evaluate errors, and verify each class, and finally evaluate the reliability of the map.
Perform Accuracy Assessment
Accuracy Assessment allows for the validation of a classification.
Classification is compared to a reference raster or reference vector. If a vector is selected as reference, it is possible to choose a field describing class values.
Several statistics are calculated such as overall accuracy, user’s accuracy, producer’s accuracy, and Kappa hat. In particular, these statistics are calculated according to the area based error matrix where each element represents the estimated area proportion of each class. This allows for estimating the unbiased user’s accuracy and producer’s accuracy, the unbiased area of classes according to reference data, and the standard error of area estimates.
Semi-Automatic Classification Plugin
Follow this tutorial- How to Install and Manage Semi-Automatic Classification Plugin.
Calculate Accuracy Assessment
1. Add the Classified images into the QGIS interface.
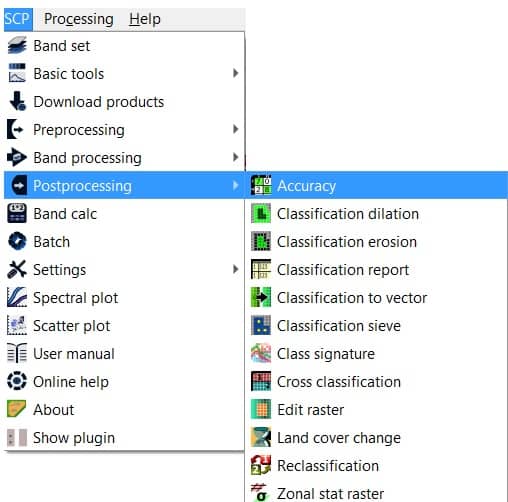
2. Now Open the SCP Band Set window with SCP > Postprocessing > Accuracy from the Main Menu.
3. Accuracy assessment window is open, Select the classification to assess– select a classification raster, refresh list.
4. Next, Select the reference vector or raster select a raster or a vector, used as reference layer for the accuracy assessment, refresh list.
5. Vector field: if a vector is selected as reference, select a vector field containing numeric class values.
6. Use value as NoData: if checked, pixels having No Data value are excluded from the calculation.
7. Finally click RUN button, choose the output destination and start the calculation.
If the output is an error raster that is a .tif file showing the errors in the map, where pixel values represent the categories of comparison between the classification and reference. Also, a text file containing the error matrix is created with the same name defined for the .tif file.