Cartography in GIS
GIS Cartography in the communication of a geographic phenomenon, the visual communication O-graph of Cart. It’s the beautiful mix of Geography for making Map layout.
What is Cartography?
Maps and mapping are the subject of the art and science known as cartography—creating two-dimensional representations of our three-dimensional Earth. These representations were once hand drawn with paper and pen. But now, map production is largely automated—and the final output is not always paper. The capabilities of a computer system are invaluable to map users, who often need to know much more about an area than can be reproduced on paper, no matter how large that piece of paper is or how small the annotation is. Maps stored on a computer can be queried, analyzed, and updated quickly.
GIS Cartography
GIS Cartography is the art and science of map-making using Geographic Information Systems (GIS). It involves creating, designing, and producing maps that communicate spatial information effectively. Its combines cartographic principles with digital tools to visualize geographic data for analysis, decision-making, and communication.
Key Components
| Component | Description |
|---|---|
| Map Design | Applying design principles like balance, contrast, hierarchy, and clarity. |
| Symbology | Using symbols, colors, and patterns to represent data meaningfully. |
| Projection & Coordinate Systems | Ensuring spatial accuracy using map projections and coordinate systems like UTM, WGS84. |
| Scale | Choosing appropriate map scales depending on detail and purpose. |
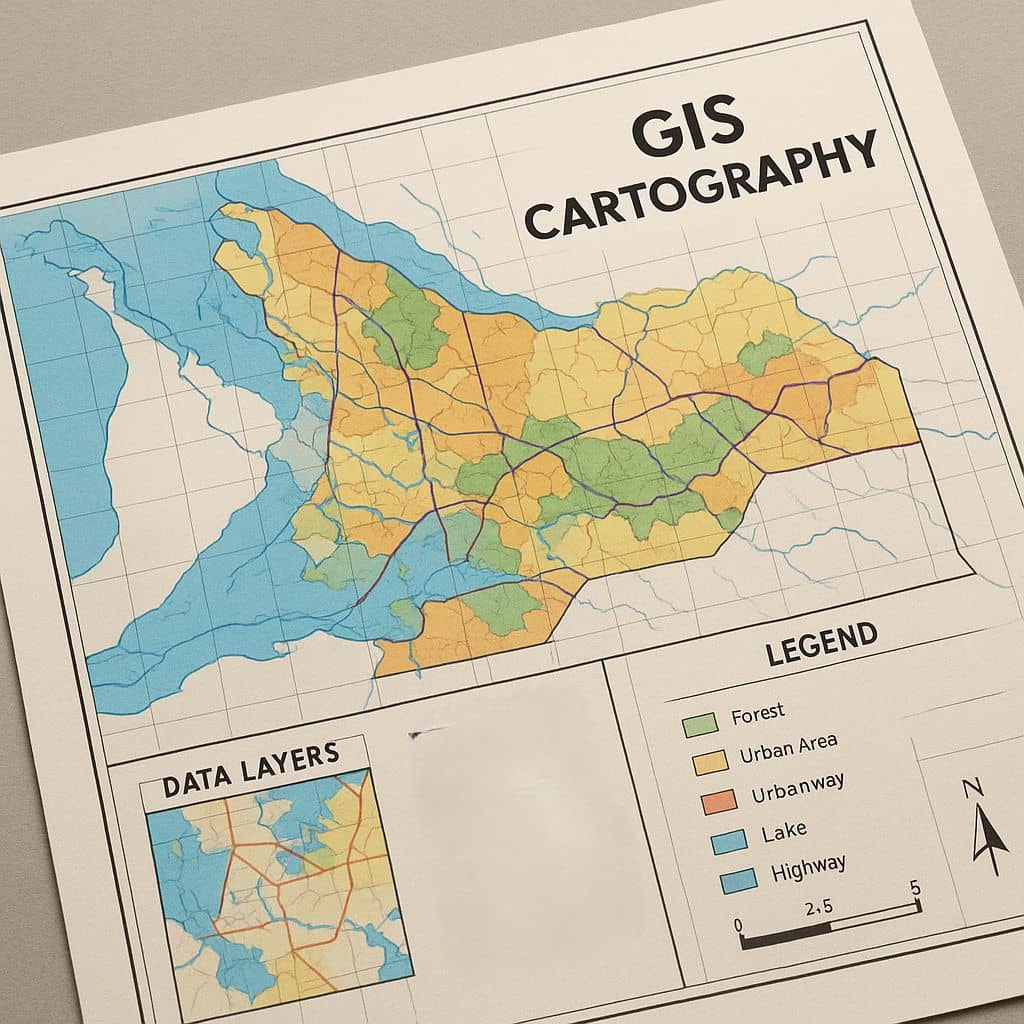
| Data Layers | Combining multiple spatial datasets (e.g., roads, rivers, land use) into layered visualizations. |
| Legend, North Arrow, Scale Bar | Essential map elements that help interpret the map. |
Elements of Cartography in GIS
Maps
A map is a graphic representation of spatial relationships on the Earth or other planets. Maps can take on many forms and sizes, depending on the intended use of the map. Maps no longer refer only to hard-copy output. In this manual, the maps discussed begin as digital files and may be printed later than GeoPDFs, slides, word processing documents, or hard copy.
Annotation
Therefore, maps usually contain several annotation elements to explain the map. Annotation is any explanatory material that accompanies a map to denote graphical features on the map. This annotation may take the form of:
- Map Scale
- Legends
- Neatlines, and Tick Marks
- Grid Lines
- Symbols (north arrows)
- Labels and Descriptive Text
Map Scale
Map scale is a statement that relates distance on a map to distance on the Earth’s surface. It is perhaps the most important information on a map, since the level of detail and map accuracy are both factors of the map scale.
Legends
A legend is a key to the colors, symbols, and line styles that are used on a map. Legends are especially useful for maps of categorical data displayed in a pseudo color, where each color represents a different feature or category.
Neatlines and Tick Marks
A neat line is a rectangular border around the image area of a map. It differs from the map border in that the border usually encloses the entire map, not just the image area.
Tick marks are small lines along the edge of the image area or neat line that show regular intervals of distance.
Grid Lines
Grid lines are intersecting lines that indicate regular intervals of distance, based on a coordinate system. Usually, they are an extension of tick marks. It is often helpful to place grid lines over the image area of a map.
Symbols
Since maps are a greatly reduced version of the real-world, objects cannot be depicted in their true shape or size. Therefore, a set of symbols is devised to represent real-world objects. There are two major classes of symbols:
• replicative
• abstract
Labels and Descriptive Text
Place name, and other labels convey important information to the reader about the features on the map. Any features that help orient the reader or are important to the content of the map should be labeled. Descriptive text on a map can include the map title and subtitle, copyright information, captions, credits, production notes, or other explanatory material.
Types of Maps in GIS Cartography
- Thematic Maps – Show specific data themes like population density, rainfall, or vegetation.
- Topographic Maps – Represent terrain and elevation using contour lines.
- Choropleth Maps – Use shading or colors to show data values by area.
- Dot Density Maps – Use dots to show frequency or occurrence.
- Heat Maps – Show data intensity or density using color gradients.