Density Analysis in ArcGIS
What is Density Map?
The Density map is a type of Thematic map that discuss about large numbers geographic distribution like population, drainage, transportation, crime, and more.
Density Analysis represents across the landscape based on the quantity that is measured at each location and the spatial relationship of the locations of the measured quantities.
ArcGIS Density Map
In ArcGIS by calculating density, you are in a sense spreading the values out over a surface. Density surfaces show where point or line features are concentrated.
Create Density Map in ArcGIS
The ArcMap offers to create 3 types of Density map:
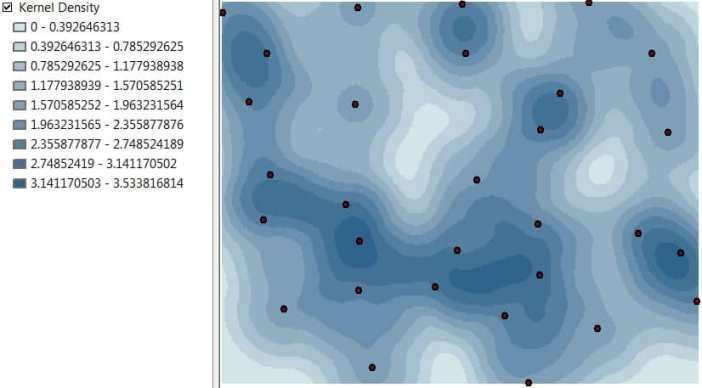
Kernel Density
Calculates a magnitude per unit area from point or polyline features using a kernel function to fit a smoothly tapered surface to each point or polyline.
In below following the steps to perform kernel density;
1. Add point feature into ArcGIS Map zone.
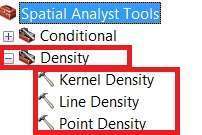
2. Open ArcToolbox, click Spatial Analyst Tools > Density > Kernel Density.
3. Kernel Density dialog box is open, Input point or polyline features field.
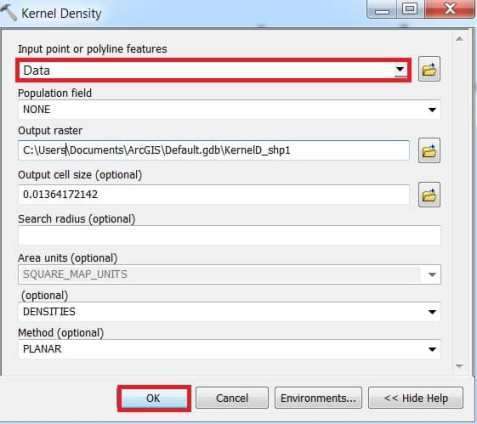
(if necessary, change the default values of the optional fields)
4. Click OK.
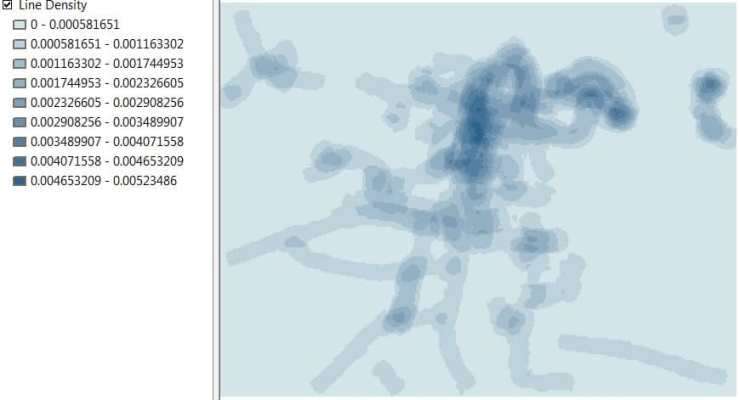
Line Density
Calculates a magnitude per unit area from polyline features that fall within a radius around each cell.
In below following the steps to perform line density;
1. Add line feature into ArcGIS Map zone.
2. Open ArcToolbox, click Spatial Analyst Tools > Density > Line Density
3. Line Density dialog box is open, Input polyline features field.
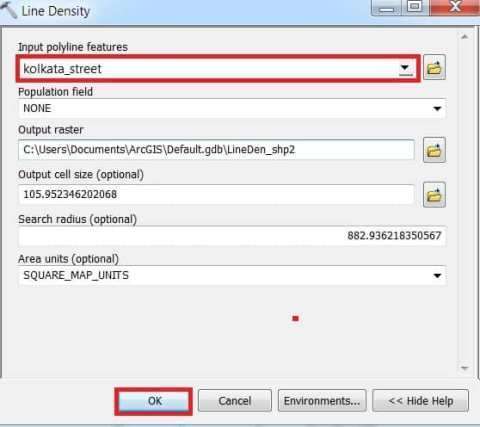
(if necessary, change the default values of the optional fields)
4. Click OK.
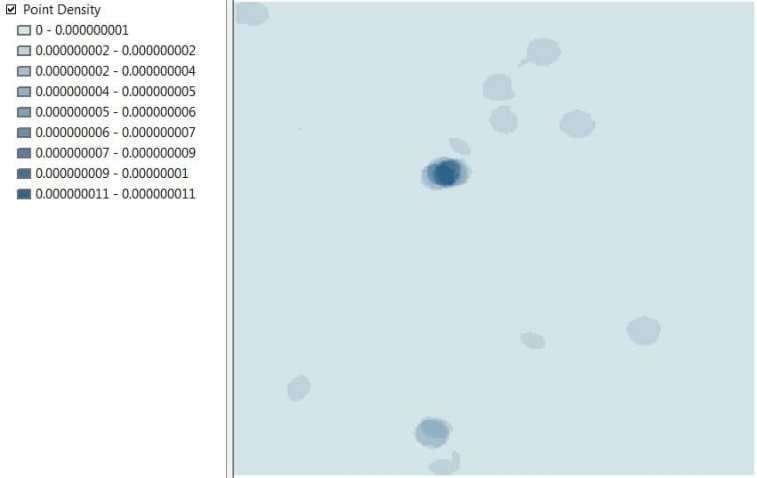
Point Density
Calculates a magnitude per unit area from point features that fall within a neighborhood around each cell.
In below following the steps to perform point density;
1. Add point feature into ArcGIS Map zone.
2. Open ArcToolbox, click Spatial Analyst Tools > Density > Point Density
3. Point Density dialog box is open, Input point features field.
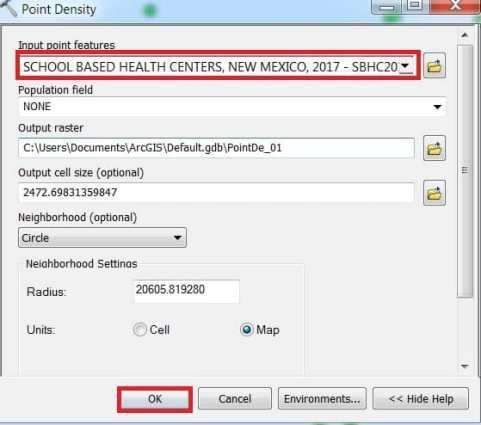
(if necessary, change the default values of the optional fields)
4. Click OK.