Environmental GIS Projects
In this tutorial we will create a Environmental GIS Projects in Behala Chowrasta, Kolkata, 700008.
Environment Approach of Road Traffic Congestion at Behala Chowrasta Crossing
Introduction
Behala Chowrasta traffic nodes has very much susceptible and problematic due to huge pressure of traffic and hike level of congestion due to hike congestion level and several environmental impact can be identified and there could be quite significant from the perspective of congestion index in this traffic nodes. Several instrumental measures have been taken into consideration to point out the scenario of environmental issues related to congestion in this traffic nodes.
Temperature and Humidity Measure
The graph showing the relationship between time and temperature with the help of Digital Thermometer between 11:20 am to 1:00 pm .The temperature is all most same the day 25 0 c to 300 c but between 12:50 to 1:00 pm (Fig: 1.1) temperature increase 300c to 350c due to huge congestion and more amount of vehicles .Therefore which is approximately throughout the location of the area and traffic and other factor is influence the temperature.
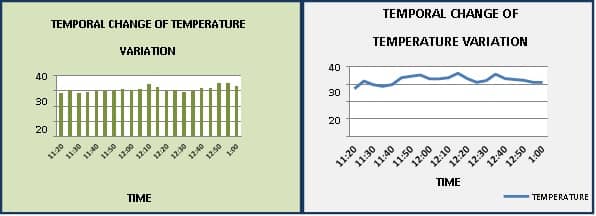
This (Fig: 1.2) graph show the relationship between time and temperature between 11:20 to 1:00 pm temperature is same in almost all the time but 11;50 to 12:30 temperature is high due to more amount of vehicles pollutants .
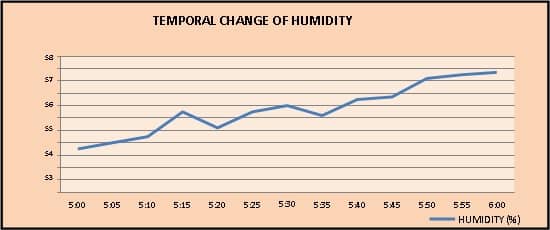
In similar time humidity can be measured with the help of digital thermometer and a significantly change can be observed that ( Fig: 1.3) a fluctuating change of humidity is upward compared to that of other time and this is because of 5 :00 pm is the transitional zone between lean and peak hours traffic at this node .
Noise Level Measurement
With the help of sound meter, noise level can be measured and it is predominantly signify the fact that almost all the time. Noise level is significantly high and it is approximately more than 70 db which is definitely harmful for ear among the human being. However more noise generation could make the noise pollution in this Behala Chowrasta traffic node.
According to this diagram a time wise (Fig: 1.4) variation of noise level can be measured in this diagram where noise level showing the time variation from 3:20 pm to 4:00 pm where showing the highest noise level is 91.5 db at the time 4:00 pm because this time maximum office and school, college have finished. The situation is observed at the rate of 80.3 db at the time 3:35 pm. This time interval the noise level are changing continuously this time interval has observed of noise level which include 81.5 , 88.6 , 89.7 , 90.2 , 86.5 , 85.3 , 85.2 in db.
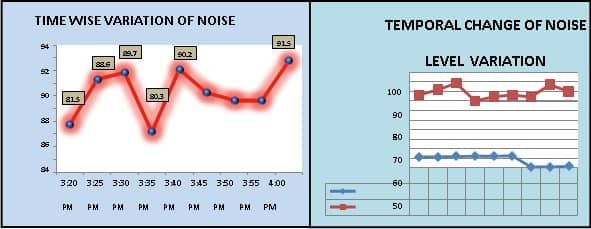
The graph showing the relationship between time and sound. Here it can be observed that the level of sound is most (Fig: 1.5) high at the rate of 88.4 db. The level of sound is low compared to that of other time when the sound has been regarded at 70 db.
Wind Speed Measurement
The graph showing the relationship between (Fig: 1.6) time and velocity between 11.20 am to 1:00 pm . Velocity is very much increase and decrease during that time. Velocity is very high 11:40 am and 11:55 am to 12:10 pm and 12:40 and 1:00 pm but the other time velocity is comparatively low.
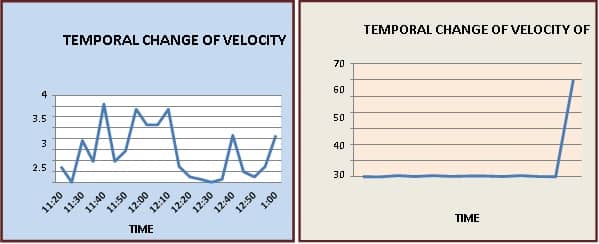
Anemometer can be used( Fig: 1.7) to measure the temporal change of velocity and it is quite obvious that after 5:45 pm velocity rate is significantly high due to more number of vehicular pressure.
Height of Metro Pillar as a Determinant of Road Traffic Congestion
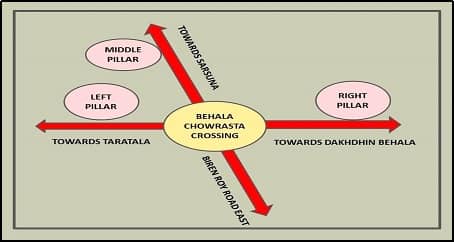
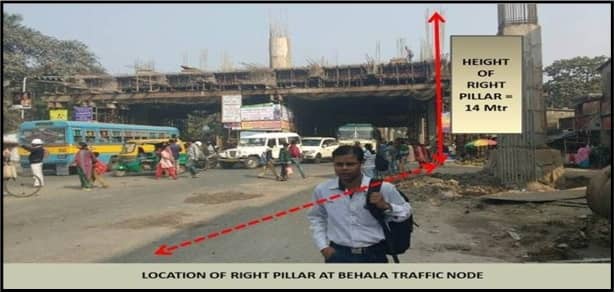
Behala traffic nodes has experienced (Photo:1.1) with metro construction since last 8 to 10 years. Automatically that leads to create traffic congestion, here the Abney level instrument can be taken to measure the angle of left right and central pillar on the collimation base and calculate the height of the pillar which could be undertaken to point out whether metro pillar has significant role for traffic congestion at Behala Chowrasta crossing or not. At the very beginning a layout plan should be made out to measure the degree of location of pillar in respect to Behala Chowrasta. Main pillar has selected adjacent xing towards Sarsuna whereas left pillar has been selected adjacent to the road of Taratala connector whereas right pillar is located right hand side of Biren Roy Road East adjacent to Dakshin Behala Connector.
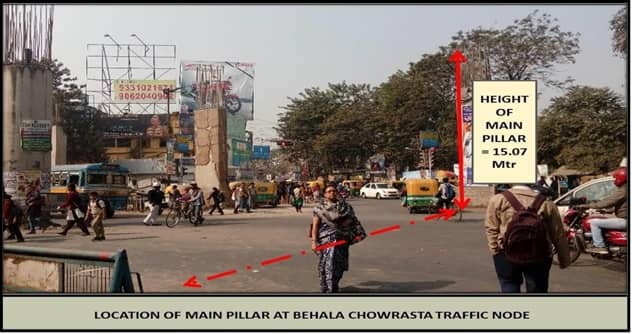
Here the height of (Photo:1.2) main pillar is approximately 15.007 meter which not adequate height for degree of metro flyover platform as well as inadequate for flaring of heavy duty vehicles.
Therefore due to the location of left pillar is quite significant where the total height is established as (Photo:1.3) 15.76 metro and somehow the location of this left pillar in front of Biren Roy Road East encroach the road space and prevent the better space mobility of traffic towards BRRE.

Therefore another right pillar has been identified (Photo:1.4) during primary survey and it is significantly the fact that this height is approximately 14 metre and it also occupied the road space and creates more traffic congestion . However before construction of the metro pillar widening space of road should be taken under consideration so that it enhances the better mobility of traffic.
Encroachment of Road Space
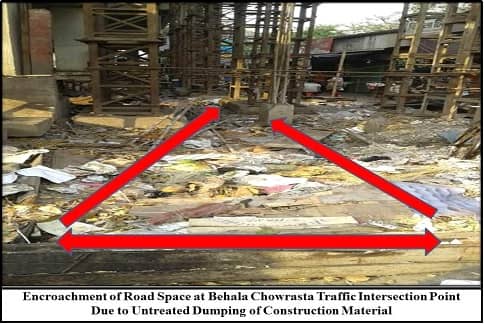
During primary survey, a significant features can be observed that, Behala Chowrasta traffic intersection point , has describing features of reducing road space due to unmanaged and untreated dumping of constructed materials which are using for metro flyover construction has described the fact that(Photo:1.5) beside the construction materials untreated solid waste such as plastics can be dumped unscientifically adjacent to Biren Roy Road juncture . There are untreated materials encroach the road space and as a result, it reduces the mobility of traffic and reduce the widening space of road.
Conclusion
At the end of the discussion , it can be conclude that conditional status of running engine should emit more amount of black fume not only that, it also emits co2, So2, VOC and NOX which create environmental pollution . Therefore this pollution could increase the temperature as well as relative humidity which convert this traffic node into heat intersection point which might be quite unsustainable for human health. Therefore due to enhance number of vehicles more noise pollution is found and red signal is stopping for more than 4 minutes during peak hours which positively favour the traffic congestion , however least road space due to untreated dumping materials as well as inadequate height of pillar could create more congestion in this traffic nodes.