GIS Statistical Analysis
Introduction
Statistics is the science that deals with collecting, analyzing, interpreting, and presenting data; informing decision-making. However, statistics alone are not relevant without being associated with a specific place.
Statistical analysis helps you extract additional information from your GIS data, such as how attribute values are distributed, whether there are spatial trends in the data, or whether the features form spatial patterns.
In GIS some of the statistical analysis techniques described in this document are most well-suited for interactive applications, such as ArcMap, that allow you to visualize and analyze data .
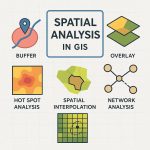
Uses of statistical Analysis in GIS
- Statistical analysis is used to explore your data.
- Another use of statistical analysis is to summarize data.
- It is also used to identify and confirm spatial patterns.
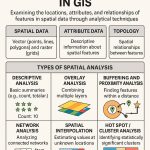
Types of GIS Statistical Analysis
| Type | Description | Example |
|---|---|---|
| Descriptive Statistics | Summarizes data (mean, median, SD) | Average rainfall per district |
| Inferential Statistics | Makes predictions or inferences | Is there a correlation between elevation and rainfall? |
| Spatial Statistics | Deals specifically with spatial patterns | Are schools clustered in urban areas? |
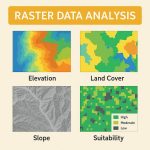
| Geostatistics | Models spatially continuous phenomena | Interpolation of temperature or air pollution |
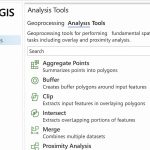
Statistical Analysis in ArcMap
Statistics Toolset
he Statistics toolset contains tools that perform standard statistical analysis, such as; mean, minimum, maximum, and standard deviation, on attribute data as well as tools that calculate area, length, and count statistics for overlapping and neighboring features.
| Tool | Description |
|---|---|
| Frequency | Creates a new table containing unique field values and the number of occurrences of each unique field value. |
| Summary Statistics | Calculates summary statistics for field in a table. |
| Tabulate Intersection | Intersection between two feature classes and cross-tabulates the area, length, or count of the intersecting features. |
Spatial Statistics Toolbox
The Spatial Statistics toolbox contains statistical tools for analyzing spatial distributions, patterns, processes, and relationships.
This tools allow you to summarize the salient characteristics of a spatial distribution, identify statistically significant spatial clusters, assess overall patterns of clustering or dispersion, identify an appropriate scale of analysis, explore spatial relationships, and more.
| Toolset | Description |
|---|---|
| Analyzing Patterns | The analyzing tools evaluate if features, or the values associated with features, form a clustered, dispersed, or random spatial pattern. |
| Mapping Clusters | These tools may be used to identify statistically significant hot spots, cold spots, or spatial outliers. |
| Measuring Geographic Distributions | These tools address questions such as Where’s the center? What’s the shape and orientation? How dispersed are the features? |
| Modeling Spatial Relationships | These tools model data relationships using regression analyses or construct spatial weights matrices. |
| Rendering | These tools may be helpful for rendering analysis results. |
| Utilities | The utility tools perform a variety of miscellaneous functions, such as; computing areas, assessing minimum distances, exporting variables and geometry, converting spatial weights files, and more. |
Applications
- Crime mapping & hotspot detection
- Environmental monitoring (e.g. air quality zones)
- Urban planning (e.g. land use vs population)
- Epidemiology (e.g. disease spread patterns)
- Agriculture (e.g. soil fertility zones)