Vector Data Analysis
Table of Contents
What is Vector Data Analysis ?
Vector data analysis uses the geometric objects of point, line, and polygon.
Examples of Vector Data Analysis
In this tutorial describe, three difference types of vector analysis;
- Proximity analysis (Buffering)
- Overlay analysis
- Extract analysis
Perform Vector Analysis in ArcGIS
Proximity Analysis (Buffering)
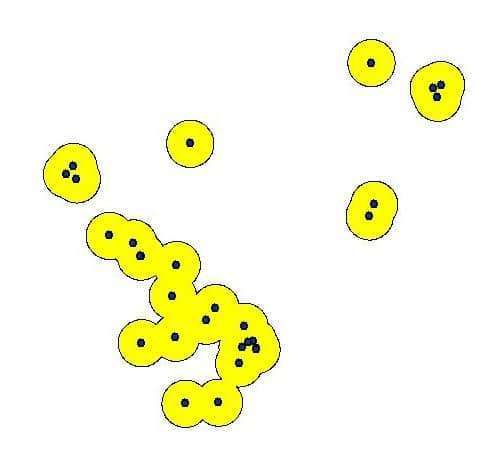
Many applications require some measurement of distance or proximity. The Proximity analysis is one way of analyzing locations of features by measuring the geographic distance between them and other features in the area.
The Proximity toolset contains tools that are used to determine the proximity of features that is Buffer.
Buffer Analysis
The buffer distance parameter can be entered as a fixed value or as a field containing numeric values.
Overlay Analysis
Overlay analysis toolset is a technique for applying a common scale of values to diverse and dissimilar inputs to create an integrated analysis.
Intersect Analysis
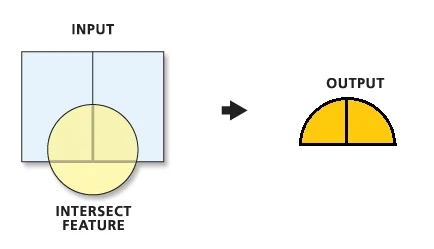
The Intersect tool calculates the geometric intersection of any number of feature classes and feature layers. The features or portion of features that are common to all inputs will be written to the output feature class.
Union Analysis
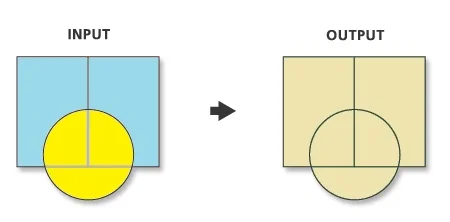
Computes a geometric Union of the input features. All features and their attributes will be written to the output feature class. Input all feature classes or feature layers must be polygons.
Erase Analysis
Creates a feature class by overlaying the Input Features with the polygons of the Erase Features. Only those portions of the input feature falling outside the erase features outside boundaries are copied to the output feature class.
Extract Analysis
The Extract tools let you select features and attributes in a feature class or table based on a query or spatial extraction. The output features and attributes are stored in a feature class or table.
Clip Analysis
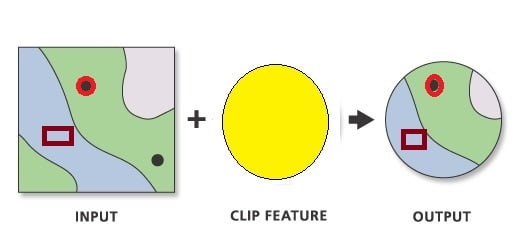
Use Clip tool to cut out a piece of one Feature class. This is particularly useful for creating a new feature class—also referred to as a study area or Area of Interest (AOI).


