Bhuvan NRSC
Bhuvan portal allows you to access Geo Spatial Services, provided satellite data of IRS sensors, satellite derived products pertaining to various themes and domains. Also specific database information is shortlisted here better visualisation of the summary of information.
National Remote Sensing Centre (NRSC) has the mandate for establishment of ground stations for receiving satellite data, generation of data products, development of techniques for Remote Sensing applications including disaster management support, geospatial services for good governance and capacity building for professionals, faculty and students, etc.
Bhuvan Satellite Data
- Satellite data 1m and lower spatial resolution are hosted on Bhuvan portal for visualisation.
- Satellite data Resourcesat seasonal AWiFS (56m), LISS III (23.5m) sensor data available for free download.
Bhuvan NOEDA Data Products
Satellite Products
| Product | Resolution | Start Period | Latest Period | Frequency | Coverage |
|---|---|---|---|---|---|
| Cartosat-1:DEM – Version-1 | 1 arc Sec (~ 32 m) | 2006 | 2008 | Single | India: 1°X1° |
| Cartosat-1:DEM – Version 1.1R1 | 1 arc Sec (~ 32 m) | 2008 | 2012 | Single | India: 1°X1° |
| Cartosat-1:DEM – Version-2R1 | 1 arc Sec (~ 32 m) | 2005 | 2014 | Single | India: 1°X1° |
| Cartosat-1:DEM – Version-3R1 | 1 arc Sec (~ 32 m) | 2005 | 2014 | Single | India: 1°X1° |
| IMS-1:Hyper spectral Imager | Spectral Binned Data (17 bands) | 2011 | 2012 | Single | India: Scene Based |
| Resourcesat-1/Resourcesat-2:AWiFS Ortho | 56 m | Dec-09 | Nov-16 | 3 times/year (8 times/year – 2016 onwards) | India: 1°X1° |
| Resourcesat-1/Resourcesat-2:LISS III Ortho | 24 m | Oct-09 | Mar-16 | 2 times/year | India: 15’X15′ |
Terrestrial Sciences Products
| Product | Resolution | Start Period | Latest Period | Frequency | Coverage Tile Extent/Spatial Extent |
|---|---|---|---|---|---|
| Annual Cropland Data set | 5Km x 5Km | 2005-06 | 2013-14 | Yearly | -10° – 45.5° N; 44.5° E – 105.5° E |
| AWiFS: Snow Albedo | 250m | 01-Jan-2015 | 05-May-2022 | 4 cycles/month | India |
| AWiFS: Water Bodies Fraction | 3′ X 3′ Grid | Oct-2004 | Mar-2022 | Fortnight | India |
| Forest Fire Regime (3 Parameters) | 5Km x 5Km | 2003 | 2017 | Yearly | 05° – 40° N; 50° E – 110° E |
| Forest Fraction Cover | 5Km x 5Km | 1930, 1975, 2013 | Yearly | 05° – 40° N; 50° E – 110° E | |
| Forest Type 5Km grid (14 Parameters) | 5Km x 5Km | 2013 | Single | 05° – 40° N; 50° E – 110° E | |
| Hydrological Products | 0.15°, 0.05° | 01-Jan-2014 | 11-Jan-2022 | India | |
| Indian Soil Datasets (3 Parameters) | 5Km x 5Km | Single | -10° – 45.5° N; 44.5° E – 105.5° E | ||
| Land Degradation (4 Parameters) | 5Km x 5Km | Single | -10° – 45.5° N; 44.5° E – 105.5° E | ||
| Mesoscale compatible inputs for: MM5 | 30 seconds, 2 minutes, 5 minutes | 2004-05 | 2018-19 | Yearly | 90° S – 90° N; 180° W – 180° E |
| Mesoscale compatible inputs for: WRF | 30 seconds, 2 minutes, 5 minutes | 2004-05 | 2018-19 | Yearly | 0° N – 40° N; 60° E – 100° E |
| Net Ecosystem Productivity – GIMMS | 2’x2′ | Single | India | ||
| Net Ecosystem Productivity – MODIS | 2’x2′ | Single | India | ||
| Net Primary Productivity – GIMMS | 2’x2′ | Single | India | ||
| Net Primary Productivity – MODIS | 2’x2′ | Single | India | ||
| OCM2: Albedo | 1 Km | Jan-2013 | Dec-2021 | Fortnight | India |
| OCM2: Filter Normalized Difference Vegetation Index | 1 Km | Jan-2012 | Jun-2021 | Fortnight | India |
| OCM2: Normalized Difference Vegetation Index – Global Coverage | 8 Km | Jun-2013 | Sep-2019 | Monthly | Global Coverage |
| OCM2: Normalized Difference Vegetation Index – Local Coverage | 1 Km | Jan-2011 | Dec-2021 | Fortnight | India |
| OCM2: Vegetation Fraction | 1 Km | Jan-2011 | Dec-2021 | Fortnight | India |
| OCM: Surface Water Layer Products_2Day Repeativity | 0.0032 deg | Nov-2013 | Feb-2016 | 2 Days | India |
| Surface Soil Moisture – 2 Day | 0.25X0.25 degree grid | Jul-2002 | 09-May-2022 | 2 days | India |
Ocean Sciences Products
| Product | Resolution | Start Period | Latest Period | Frequency | Coverage Tile Extent/Spatial Extent |
|---|---|---|---|---|---|
| Chlorophyll – OC2 – Global | 4Km | Jan-2011 | Dec-2020 | 8 Day, Monthly | 90° S – 90° N; 0° E – 360° E |
| Chlorophyll – OC2 – North indian ocean | 1Km | Jan-2010 | Mar-2020 | 2 Day, 8 Day, Monthly | 0° N – 30° N; 45° E – 100° E |
| Chlorophyll – OC4 – Global | 4Km | Jan-2011 | Dec-2020 | 8 Day, Monthly | 90° S – 90° N; 0° E – 360° E |
| Chlorophyll – OC4 – North indian ocean | 1Km | Jan-2010 | Mar-2020 | 2 Day, 8 Day, Monthly | 0° N – 30° N; 45° E – 100° E |
| Co-Tidal Map (K1O1) Amplitude-Phase | 2’x2′ | Single | 5.5° N – 24° N; 68° E – 89.5° E | ||
| Co-Tidal Map (M2S2) Amplitude-Phase | 2’x2′ | Single | 5.5° N – 24° N; 68° E – 89.5° E | ||
| Daily Ocean Heat Content of 700m Layer | 0.25° | 01-Jan-2002 | till date (-7 days) | Daily | North Indian Ocean (30S – 30N; 30-120E ) |
| Daily Ocean Mean Temperature & Heat Content of Different Layers | 0.25° | 01-Jan-1998 | till date (-7 days) | Daily | 30° S – 30° N; 30° E – 120° E |
| Daily Tropical Cyclone Heat Potential | 0.25° | 01-Jan-1998 | till date (-7 days) | Daily | North Indian Ocean (30S – 30N; 30-120E ) |
| Diffuse Attenuation Coefficient at 490 nm – Global | 4Km | Jan-2011 | Dec-2020 | 8 Day, Monthly | 90° S – 90° N; 0° E – 360° E |
| Diffuse Attenuation Coefficient at 490 nm – North Indian ocean | 1Km | Jan-2010 | Mar-2020 | 2 Day, 8 Day, Monthly | 0° N – 30° N; 45° E – 100° E |
| Dissolved Inorganic Carbon | 25Km | 01-Jan-2014 | 15-Jan-2018 | 7 Day | 90° S – 90° N; 0° E – 360° E |
| Eddy Kinetic Energy | 0.25° X 0.25° | Jan-1993 | Apr-2021 | Monthly | 30° S – 30° N; 40° E – 110° E |
| Eddy Kinetic Energy – Daily | 0.25° X 0.25° | 01-Jan-1993 | 01-Jan-2022 | Daily | 30° S – 30° N; 40° E – 110° E |
| Ekman Currents – Global | 50Km | 01-Apr-2013 | 24-Sep-2020 | Daily | 90° S – 90° N; 0° E – 360° E |
| Ekman Currents – Indian Ocean | 0.25° X 0.25° | 01-Apr-2013 | 21-Feb-2014 | Daily | 30° S – 30° N; 30° E – 120° E |
| Geostrophic Currents – Global | 25Km | 01-Apr-2013 | 24-Sep-2020 | Daily | 90° S – 90° N; 0° E – 360° E |
| Geostrophic Currents – Indian Ocean | 0.25° X 0.25° | 01-Apr-2013 | 08-May-2014 | Daily | 30° S – 30° N; 30° E – 120° E |
| Mean Sea Level Anomaly | 0.33° X 0.33° | Jan-1993 | Dec-2011 | Monthly | 10° S – 30° N; 40° E – 110° E |
| Model Derived Depth of 26°C ISOTHERM | 0.5° x 0.5° | 11-Jul-2013 | till date (-15 days) | Daily | 30° S – 30° N; 30° E – 120° E |
| Model Derived Tropical Cyclone Heat Potential | 0.5° x 0.5° | 11-Jul-2013 | till date (-15 days) | Daily | 30° S – 30° N; 30° E – 120° E |
| OSCAT Ocean Wind – 25Km | 25Km | 07-Jan-2010 | 29-Jan-2014 | Daily | 90° S – 90° N; 0° E – 360° E |
| OSCAT Ocean Wind – 50Km | 0.5° x 0.5° | 02-Jan-2010 | 01-Jan-2014 | Daily | 90° S – 90° N; 0° E – 360° E |
| OSCAT Ocean Wind Curl – 25Km | 25Km | 07-Jan-2010 | 29-Jan-2014 | Daily | 90° S – 90° N; 0° E – 360° E |
| OSCAT Ocean Wind Curl – 50Km | 0.5° x 0.5° | 02-Jan-2010 | 01-Jan-2014 | Daily | 90° S – 90° N; 0° E – 360° E |
| OSCAT Ocean Wind Stress – 25Km | 25Km | 07-Jan-2010 | 29-Jan-2014 | Daily | 90° S – 90° N; 0° E – 360° E |
| OSCAT Ocean Wind Stress – 50Km | 0.5° x 0.5° | 02-Jan-2010 | 01-Jan-2014 | Daily | 90° S – 90° N; 0° E – 360° E |
| SCATSAT Ocean Wind – 25Km | 25Km | 17-Oct-2016 | 26-Oct-2020 | Daily | 90° S – 90° N; 0° E – 360° E |
| SCATSAT Ocean Wind – 50Km | 50Km | 03-Nov-2016 | 27-Oct-2020 | Daily | 90° S – 90° N; 0° E – 360° E |
| SCATSAT Ocean Wind Curl – 25Km | 25Km | 17-Oct-2016 | 26-Oct-2020 | Daily | 90° S – 90° N; 0° E – 360° E |
| SCATSAT Ocean Wind Curl – 50Km | 50Km | 03-Nov-2016 | 27-Oct-2020 | Daily | 90° S – 90° N; 0° E – 360° E |
| SCATSAT Ocean Wind Stress – 25Km | 25Km | 17-Oct-2016 | 26-Oct-2020 | Daily | 90° S – 90° N; 0° E – 360° E |
| SCATSAT Ocean Wind Stress – 50Km | 50Km | 03-Nov-2016 | 27-Oct-2020 | Daily | 90° S – 90° N; 0° E – 360° E |
| SCATSAT Sea Level Pressure | 0.5° x 0.5° | 11-Oct-2016 | 01-Mar-2021 | Daily | Global Oceans |
| Sea Level Pressure | 50Km | 01-Feb-2010 | 30-Jan-2014 | Daily | 90° S – 90° N; 0° E – 360° E |
| Sea Surface Height – Global | 25Km | 01-Apr-2013 | 24-Sep-2020 | Daily | 90° S – 90° N; 0° E – 360° E |
| Sea Surface Height – Indian Ocean | 0.25° X 0.25° | 01-Apr-2013 | 21-Feb-2014 | Daily | 30° S – 30° N; 30° E – 120° E |
| Total Alkalinity | 25Km | 01-Jan-2014 | 03-Jan-2018 | Daily | 90° S – 90° N; 0° E – 360° E |
| Total Currents – Global | 25Km | 01-Apr-2013 | 24-Sep-2020 | Daily | 90° S – 90° N; 0° E – 360° E |
| Total Currents – Indian Ocean | 0.25° X 0.25° | 01-Apr-2013 | 21-Feb-2014 | Daily | 30° S – 30° N; 30° E – 120° E |
Cryospheric Products
| Product | Resolution | Start Period | Latest Period | Frequency | Coverage Tile Extent/Spatial Extent |
|---|---|---|---|---|---|
| AWiFS: Snow Cover Fraction | 3′ X 3′ Grid | Jan-2012 | Apr-2022 | Fortnight | Himalaya Region |
| Snow Melt and Freeze | 2.225 degree | Jan-2000 | Dec-2018 | 2 Day | Himalaya Region |
| Snowmelt Antarctica | 2.225 degree | 02-Nov-2001 | 26-Feb-2021 | Daily | Antarctica |
Atmospheric and Climate Sciences Products
| Product | Resolution | Start Period | Latest Period | Frequency | Coverage Tile Extent/Spatial Extent |
|---|---|---|---|---|---|
| Cloud Fraction and Cloud Cover | 0.10° x 0.10° , 0.25° x 0.25° | 01-Sep-2008 | 16-Jan-2021 | Half-Hourly | Indian Sub-continent (-10° – 45.5° N; 44.5° E – 105.5° E) |
| Derived Tropospheric Ozone | 1° x 1° | 01-Jan-2010 | 13-Mar-2022 | Daily | 0° – 40° N; 60° E – 100° E |
| Planetary Boundary Layer Height (Daily, 7 Day, Monthly) | 0.25° x 0.25° | 01-Sep-2014 | 01-Sep-2021 | Daily | 05° – 40° N; 50° E – 110° E |
Bhuvan Thematic Services
| S.No. | Theme | Scale | Availability | Features | Webservices (WMS/WMTS) URL’s | Datasets/Products/Reports Available |
|---|---|---|---|---|---|---|
| 1 | Land Use Land Cover | 1:50000 | 2005-06 | Metadata, Analaysis, Statistics | WMTS: “https://bhuvan-vec2.nrsc.gov.in/bhuvan/gwc/service/wmts” WMS: “https://bhuvan-vec2.nrsc.gov.in/bhuvan/wms” | Technical Document , Map |
| 2 | Land Use Land Cover | 1:50000 | 2011-12 | Metadata, Analysis, Statistics | WMTS: “https://bhuvan-vec2.nrsc.gov.in/bhuvan/gwc/service/wmts” WMS: “https://bhuvan-vec2.nrsc.gov.in/bhuvan/wms” | Technical Document |
| 3 | Land Use Land Cover | 1:50000 | 2015-16 | Metadata, Analysis, Statistics | WMTS: “https://bhuvan-vec2.nrsc.gov.in/bhuvan/gwc/service/wmts” WMS: “https://bhuvan-vec2.nrsc.gov.in/bhuvan/wms” | Technical Document |
| 4 | Land Use Land Cover | 1:250000 | 2004-05, 2005-06, …, 2016-17 | Metadata, Statistics | WMS: “https://bhuvan-ras2.nrsc.gov.in/cgi-bin/LULC250K.exe” | Data for Download , Technical Document , Map |
| 5 | Land Use Land Cover: SIS-DP | 1:10000 | 637 Districts | Visualization | – | |
| 6 | Land Degradation | 1:50000 | 2005 – 2006 | Metadata, Statistics | WMTS: “https://bhuvan-vec2.nrsc.gov.in/bhuvan/gwc/service/wmts” WMS: “https://bhuvan-vec2.nrsc.gov.in/bhuvan/wms” | Technical Document , Map |
| 7 | Land Degradation | 1:50000 | 2015 – 2016 | Metadata, Statistics | WMTS: “https://bhuvan-vec2.nrsc.gov.in/bhuvan/gwc/service/wmts” WMS: “https://bhuvan-vec2.nrsc.gov.in/bhuvan/wms” | Technical Document , Map |
| 8 | Urban Land Use: NUIS | 1:10000 | 2006-07 | Metadata | WMTS: “https://bhuvan-vec1.nrsc.gov.in/bhuvan/nuis/gwc/service/wmts” WMS: “https://bhuvan-vec1.nrsc.gov.in/bhuvan/nuis/wms” | Technical Document , Map |
| 9 | Wasteland | 1:50000 | 2008-09 | Statistics, Analysis, Query Shell, Metadata | WMTS: “https://bhuvan-vec2.nrsc.gov.in/bhuvan/gwc/service/wmts” WMS: “https://bhuvan-vec2.nrsc.gov.in/bhuvan/wms” | Technical Document , Map |
| 10 | Wasteland | 1:50000 | 2015-16 | Statistics, Analysis, Query Shell, Metadata | WMTS: “https://bhuvan-vec2.nrsc.gov.in/bhuvan/gwc/service/wmts” WMS: “https://bhuvan-vec2.nrsc.gov.in/bhuvan/wms” | Technical Document , Map |
| 11 | Glacial Lakes/Waterbodies | 1:250000 | Indian Himalayas | Metadata | WMTS: “https://bhuvan-vec2.nrsc.gov.in/bhuvan/gwc/service/wmts” WMS: “https://bhuvan-vec2.nrsc.gov.in/bhuvan/wms” | Technical Document |
| 12 | Geomorphology | 1:50000 | 2005-06 | Metadata | WMTS: “https://bhuvan-vec2.nrsc.gov.in/bhuvan/gwc/service/wmts” WMS: “https://bhuvan-vec2.nrsc.gov.in/bhuvan/wms” | Technical Document , Map |
| 13 | Lineament | 1:50000 | Metadata | WMTS: “https://bhuvan-vec2.nrsc.gov.in/bhuvan/gwc/service/wmts” WMS: “https://bhuvan-vec2.nrsc.gov.in/bhuvan/wms” | Technical Document , Map | |
| 14 | Flood Hazard | 1:250000 | Derived from data aquired during floods: 1998-2007 | Statistics, Analysis, Metadata | WMS: “https://bhuvan-ras2.nrsc.gov.in/cgi-bin/hazard.exe” | Technical Document , Map |
| 15 | Flood Annual Layers | 1:250000 | 1999 – 2010 | Metadata | WMS: “https://bhuvan-ras2.nrsc.gov.in/cgi-bin/flood.exe” | Technical Document , Map |
| 16 | Urban Sprawl | 2005-2006, 2011-12 (5 States) | Visualization | – |
Bhuvan Natural Resources Census Services
- Land Use Land Cover: 1:250000
- Land Use Land Cover: 1:50000
- Land Use Land Cover: 1:10000
- Geomorphology
- Erosion Maps
- Salt Affected & Waterlogging
How to use/ Download Data in Bhuvan NRSC
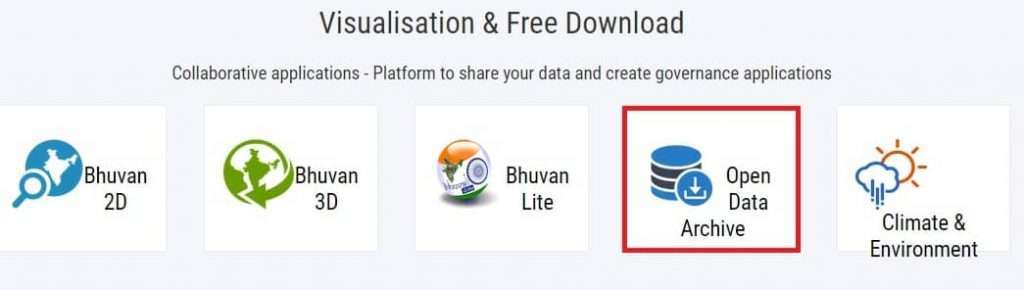
Open the Bhuvan web portal, on the Home page select Open Data Archive.
On the Open Data Archive page, select a sub-category, and choose Satellite/Sensor.
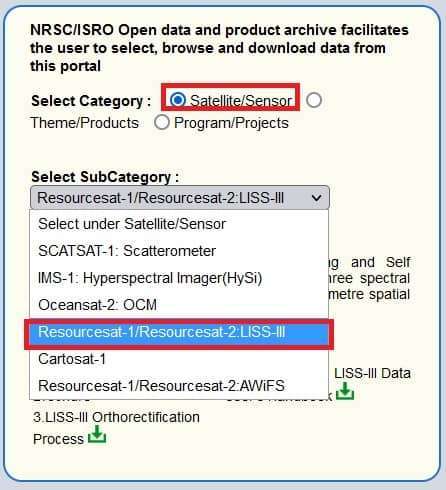
You can already select Satellite/Sensor, in the next step select Area.
5 options are available to download Satellite Imagery Data.
- Bounding Box
- Mapsheet
- Tiles
- Interactive
- Drawing
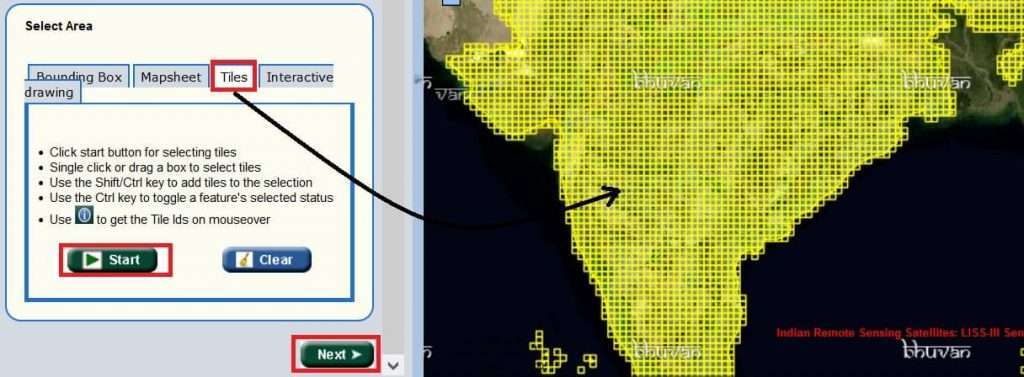
Tiles are the best option to download data. Because it has already there in the map.
Select Tiles, and zoom in on the map, click the ‘Start’ button. Select your Tiles area, then click the ‘Next’ button.
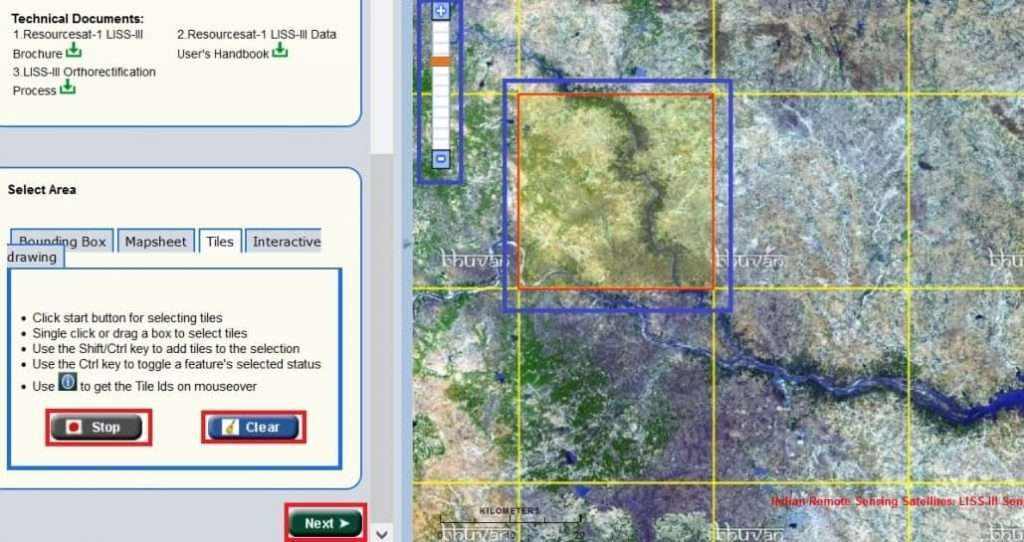
Selection process is completed, click ‘Stop’ button. Also you can select to another Tiles/Area click the ‘Clear’ button
Now see the list of Total Tiles available for this selection.
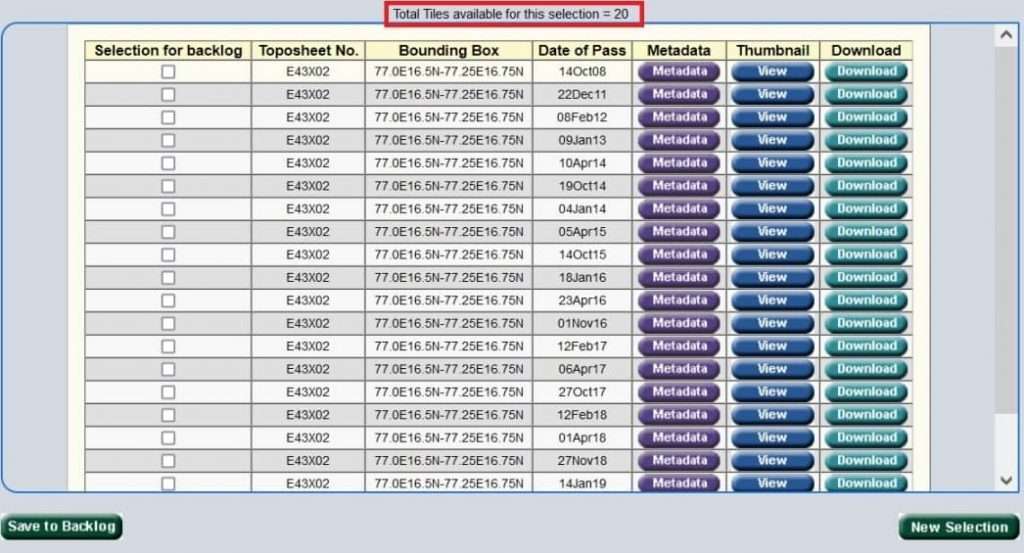
Select any Backlog, and click View for view the Satellite Image, also click Metadata for view full Data details.
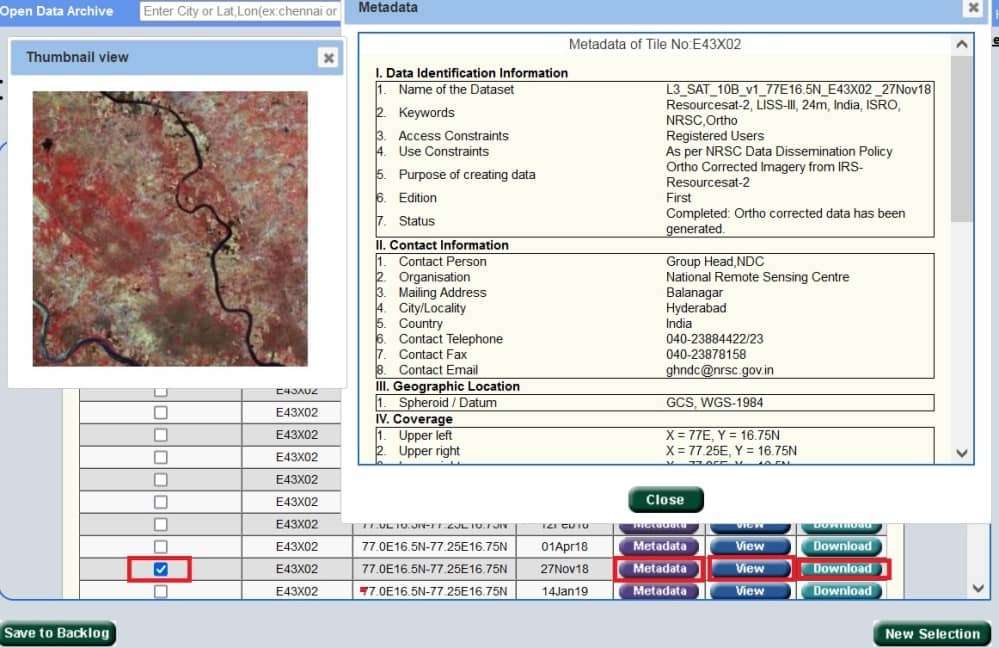
Before you can jump to the download, first Sign up/ Login to the Bhuvan portal.

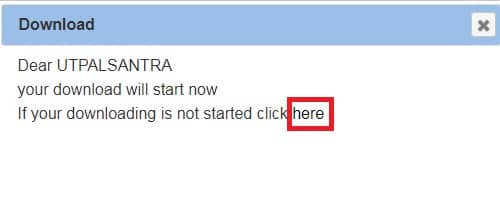
Download data click Download, download window appear, click, here.
You can change the data or choose other area, click ‘New Selection‘![]() button.
button.