Learn ArcGIS Pro: Predicted Economic Growth
In this ArcGIS Pro Tutorial Learn How to Predict Economic Growth using ArcGIS Pro.
Create Predicted Economic Growth
Create a scene
Start ArcGIS Pro, Under New, choose Local Scene. Create a new folder for this project.
On the Ribbon on the Map tab, in the Layer group, expand the Basemap gallery. Choose Dark Gray Canvas or Imagery, as you choose.
Add Data
1. In the Catalog pane, expand Folders and add Data (optional data add is available, select Map tab, in Layer group expand Add Data and choose Data).
2. Now select the Boundary layer.
3. The new layer is added to the map. Boundary layer is show to polygon feature and Job growth is point feature. you’ll change the Display setting Boundary layer.
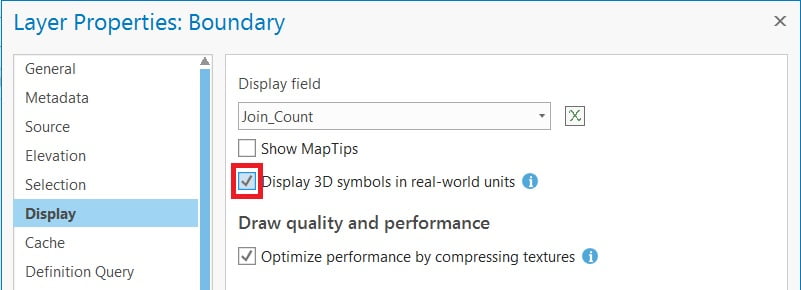
4. In the Contents pane, right-click the new layer and choose Properties > In the Layer Properties window, click the Display tab and check the Display 3D symbols in real-world units box.
Symbolize job growth data
To symbolize the projected job growth, you’ll use a preset. n this case, they’re a quick way to show 3D data.
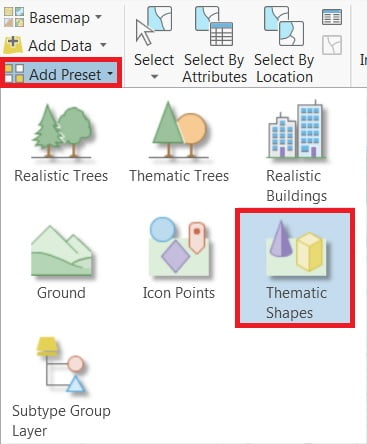
1. On the ribbon, on the Map tab, in the Layer group, click Add Preset and choose Thematic Shapes.
2. In the Add Data window, browse to the project folder and double-click the data (job growth).
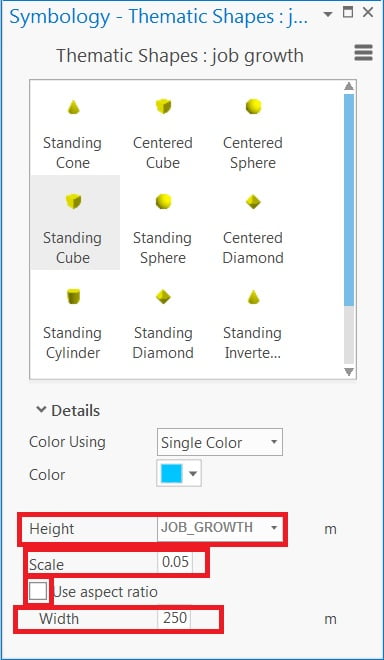
3. In the Symbology pane, choose the Cube Cylinder symbol.
4. For Height, expand the menu and choose the Field Attribute (JOB_GROWTH). For Scale, type 0.05 (This decimal defines the aspect ratio—each symbol’s height will be multiplied by 0.05.). Uncheck Use aspect ratio. For Width, type 250.
Symbolize Housing data
1. In the Catalog pane, browse to the housing data and add the data. In the Contents pane, drag the housing layer just added from 2D Layers to 3D Layers.
2. Right-click the Housing Growth layer and choose Properties. On the Display tab, check the Display 3D symbols in real-world units box, then click OK.
3. Click the symbol for the Housing Growth layer to open its symbology. In the Symbology pane, click the Gallery tab select standing cylinder symbols.
4. Click the Properties tab and click the Layers button.
5. If necessary, expand Appearance and change Height to 200 m. The Width and Depth fields change to match, click Apply.
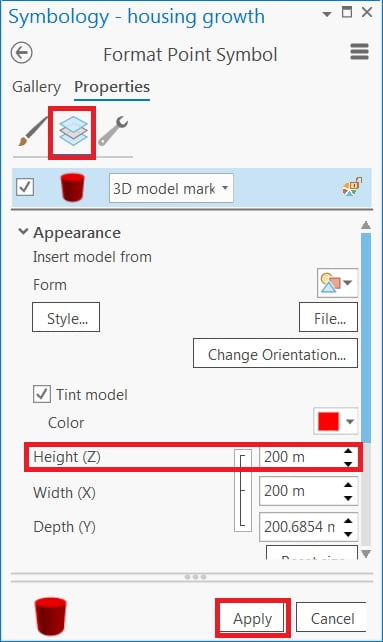
(All the cube symbols now stand 200 meters high. You’ll use the same aspect ratio as before, 0.05 times their actual value.)
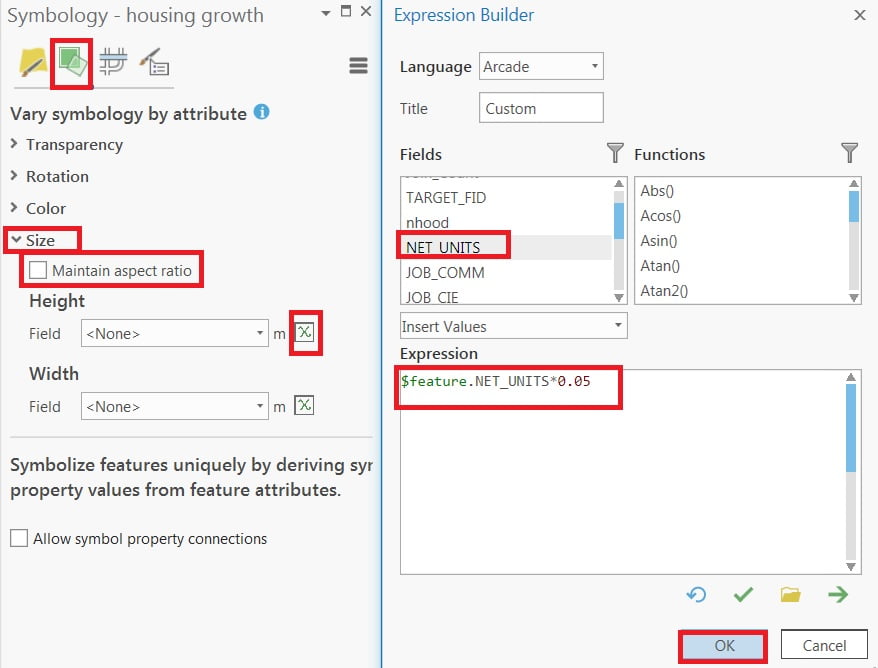
6. In the Symbology pane, click the back arrow, and then next to the Primary Symbology button, click Vary symbology by attribute. Expand Size. Under Size, uncheck Maintain aspect ratio.
(If maintain the aspect ratio, the width and depth of the cube will change when you calculate the height.)
7. Under Height, for Field, click Set an expression.In the Expression Builder window, under Fields, double-click NET_UNITS.
8. After the NET_UNITS attribute, type * 0.05 to ($feature.NET_UNITS * 0.05), and Click OK.
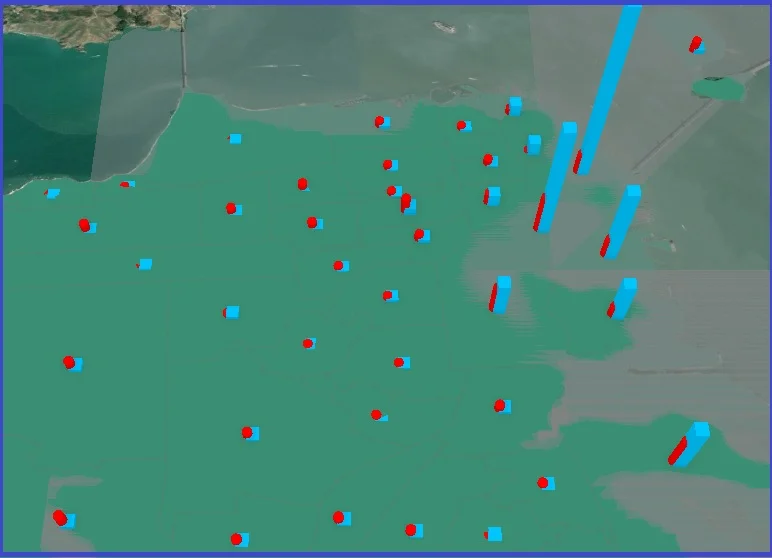
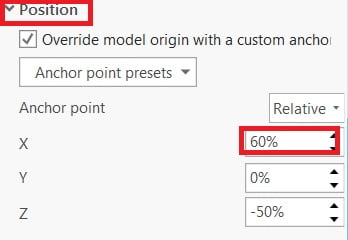
The housing data is correctly symbolized now, but there is a visual problem in the scene, the symbols for the two layers are centered in the same location. so now to Fix it.
9. In the Symbology pane, Expand Position and change X value (60%), and Apply.
10. Save the project, and you can also create a Layout.