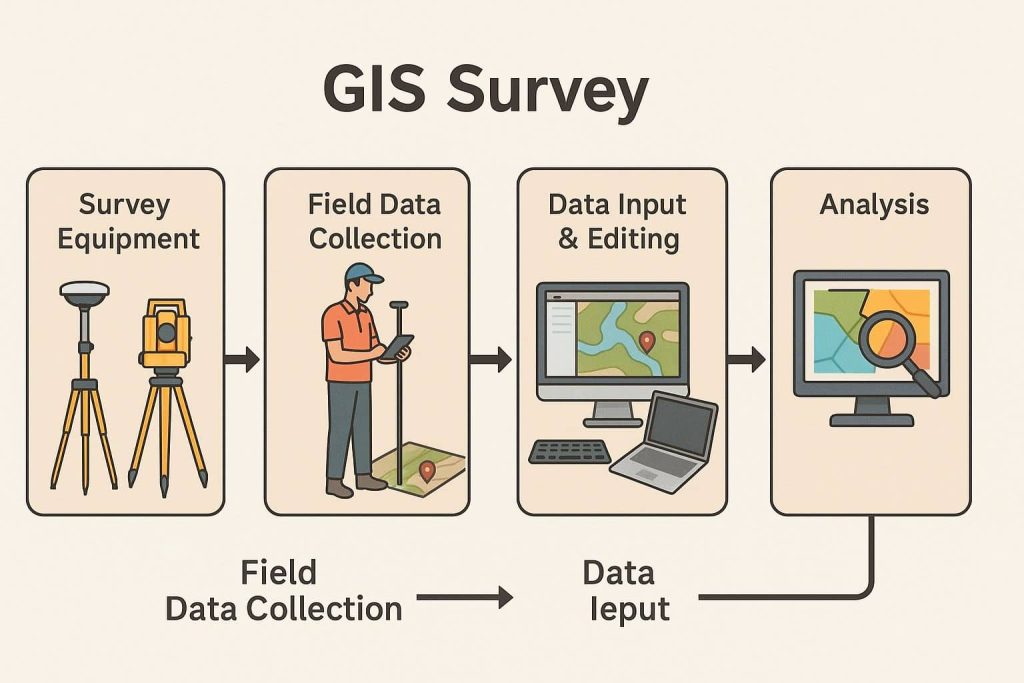
GIS Survey
GIS Surveying is a field analysis or research to collect accurate information of any land, ocean or other features.
Geospatial Survey helps you to analysis Physical phenomena in the World. It’ also allows us to find out what is happening inside a specific area or nearby to a specific area.
The GIS Surveyors survey for gather existing information, collect new information, analyze data, produce plans, manage projects, and deliver accurate data. Surveyors use GIS to manage the entire planning aspect of a surveying project. GIS provides the tools necessary to research, develop, implement, and monitor the progress of a project and manage site location, environmental impact mitigation, economic analysis, and other critical facets.
GIS Survey Tutorial
In this tutorial learn, how to GIS Survey work, and it’s practical implementation.
Survey Example
In this lesson, survey for, the land use change.
Introduction
Land use of a region is the mirror image of the people’s livelihood. In rural areas, agricultural land plays the dominant role in its economy and built-up area, i.e. residential, commercial and industrial area which controls the economic activities of the region. Land use change occurs due to various reasons in different places and time.
Finally, analysis of land use change may be undertaken for evaluating either past, present or future changes in patterns of land use in terms of certain criteria such as environmental deterioration or improvement, economic decline or growth, social impoverishment, or more generally against the criterion of sustainability.
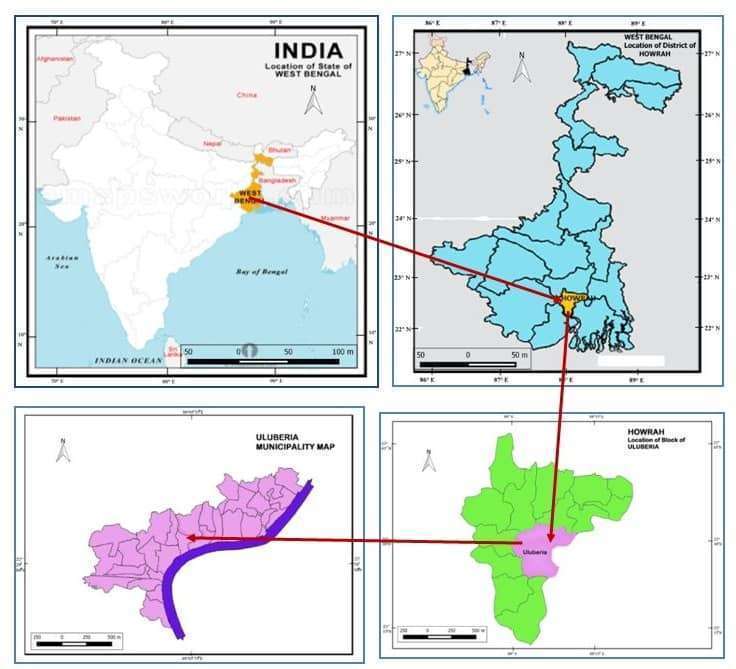
Study Area
The selected study area for survey Haora’s small town Uluberia.
The study area of this research work is confined within the limits of Uluberia Municipality area covering total area of 34.10 sq.km. It is under to Kolkata municipal corporation in West Bengal, situated on the left bank of River Hooghly in the lower Gangetic deltaic plain.
Objectives
The aim of this study is to produce a land use map of Uluberia municipality in order to detect the changes that have taken place over a 10 year period using change detection method. The following specific objectives are pursued in order to achieve the aim;
- To create a land use and land cover classification scheme.
- To summarize physical and anthropogenic factors pertaining to land use in Uluberia municipality.
- To study the general land use area under respective categories.
- To detect the spatio-temporal changes in land use in the study area.
General Research About the Study Area
Introduction: The municipal town of Uluberia is located on the West bank of River Hugli and is situated at a distance of 34 Km from Haora railway station. The town is delineated by the rural Mouzas under Gram Panchayat on the north, west, south and on the east and southeast by the river Hugli. Latitudinal and Longitudinal expansion of the municipality is 22°48’ N and 88°23’ E respectively.
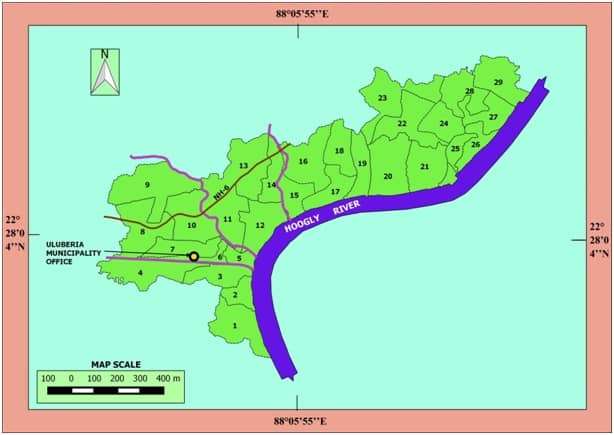
The total area of the study area is 34.10 sq. km. The area is situated on the west bank of river Hugli in the Haora District. Being a part of the Gangetic plain, this municipality has mainly alluvial soil so the terrain is move or less flat with numerous ponds and ditches. The presence of perennial channels with proper slopes helps the town’s surface drainage.
Climate And Rainfall : The climate is generally hot and humid for a major part of the year. Monsoon normally starts from the second week of June and persists up to the second week of September. The winter lasts for two months December and January.
Rainfall is low between November and February, and high around in March and April. During the monsoon season weather conditions are similar to that of other parts of the southern districts of the state.The rainfall results chiefly of the cyclonic storm, which forms in the northwest angle of the Bay of Bengal, and influence the whole of the southwest of the province. Rains are also caused by inland depressions, which form over the central districts of the Bengal and moved slowly westward. The average rainfall remains around 1400 cm.
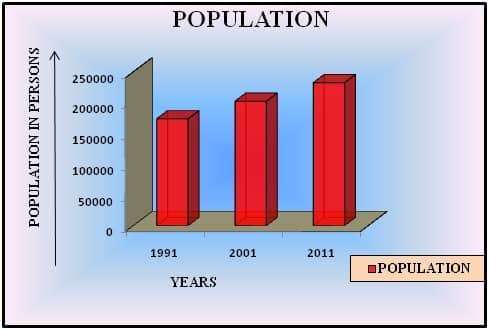
Population Growth : Uluberia municipality has experienced sudden population flux that started to overcrowd this small town. A sharp rise in total population is observed between 1991 to 2001, when the decadal growth rate was almost 31%. According to 2011 census the total population of the area comprises 232290.
Education: According to the latest data, Uluberia is seriously lagging behind all India average in literacy perspective. The total literacy rate of the study area is only 81.10% that is far behind the same of KMC and Haora District.
Transport connectivity: The study area is well connected with the other part of the state as well as the country by both railway, roadway and inland waterway.
- Railways: Uluberia, the sub divisional head quarter of the Haora district are well connected by the southeastern railway. The municipal area extends in four railway stations of southeastern railway line. They are Bauria, Chengail, Phuleswar and Uluberia. It runs through the town which connects the cities of Kolkata, Haora, Kharagpur, Jamshedpur, Bilaspur, Mumbai to Uluberia.
- Roadways: The National Highway –6 passes through Uluberia in an east west direction. Uluberia is about 40 Km from Kolkata by road. Recent expansion of this highway enabled fast and smooth transportation to Kolkata, Haldia port and other parts of India. Next to NH-6, the most important roadway in Uluberia is Odisha Trunk Road (O.T. Road). It is a state highway.
- Waterways: Uluberia has the potential of being developed as a waterway linkage from Haora Kolkata. At present the town is well connected with Pujali, Budge Budge Municipality by River. There are three important ferry services under its jurisdiction. They are as follows:
- Uluberia Ferry Ghat: It was established during the British period. It connects Uluberia Municipality and Pujali Municipality. It takes 7 minutes to reach Pujali (near to Kolkata). Ticket fare Rs. 2.50. Here motor boat is used. The service is available from 6.00 AM to 8.00 PM. Along with persons, animals like cow, goat, hen, etc. are carried. Motorbike and cycles are also carried, from one ghat to another. On an average 20-30 persons are carried on each trip. At the office time it is about 50 persons on a trip.
- Jhoutala Ferry Ghat: It connects Bauria Thana Ghat with Budge Budge Jute mill (near to Budge Budge Station). It takes 7 minutes to cover a trip. Here motor boat is used. Ticket fare: Rs. 3.00 for a person, Rs. 12.00 for a motorbike and Rs. 3.00 for a cycle. The service is available from 5.15 AM to 10.15 PM. During the office hours (7.15 -11.00) AM & (3.00- 8.15) PM the boat leaves the ghat in 15mins interval. But for the rest of the time a gap of 30 minutes is maintained. On an average 20-30 persons are carried on each trip. At the office time it is about 50 persons per trip.
- Bauria Budge Budge Ferry Service: It connects Bauria to Bugde Bugde Station (very near to Kolkata). It is maintained by Hugli Nadi Jalopath Paribahan Samobay Samiti Limited. It was established in 1992 in the old jetty ghat land. In 1994 it was newly constructed. At first there was a wooden jetty ghat, but in 1996-97 it was transferred to metallic jetty ghat. The time required to reach Budge Budge is only 5 minutes. Ticket fare is Rs. 4.00. The service starts from 5.15 AM – 10.30 PM. The gap of 15 minutes is maintained between the two vessels during the office time, that is from (6.00- 11.00) AM & (3.30-8.30) P. In the rest of the time, an interval of 30 minutes is followed by the administrative body. Three types of vessel are found in the Hugli River. They are – Brick, Middy Steel and Wooden vessel. The wooden vessel is normally used. During the festival seasons the Steel vessel is hired from Kolkata Dock. On an average it carries 100 passengers . The capacity of each vessel is about (200-250) persons. There are about 38 staffs are working here.
Land Use Details of Uluberia Municipality (2015) : Uluberia Municipality areas land use is Residential area is 63.19 percent, Mixed land 7.70 percent, Industrial area 7.13 percent, agricultural land is almost 18.09 percent cover and Commercial, Public Land and Education cover 4.45percent area.
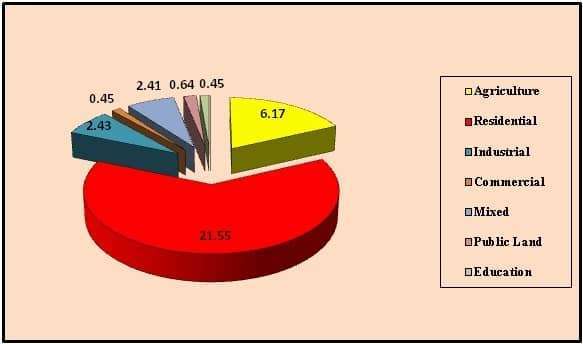
Image Classification
One of the objectives of the study was to generate a spatial GIS database for the study area. Image classification procedure is to automatically categorize all pixels in an image into land cover and land use classes or themes. Normally, multi-spectral data are used to perform the classification and, the spectral pattern present within the data for each pixel is used as the numerical basis for categorization. That is, different feature types manifest different combinations of DNs based on their inherent spectral reflectance and remittance properties. Spectral pattern recognition refers to the family of classification procedures that utilizes this pixel-by-pixel spectral information as the basis for the automated land cover and land use classification.
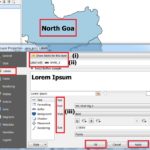
Supervised Classification
To emphasize spectrally oriented classification procedures for land cover and land use mapping. Supervised Classification, the image analyst ‘supervises’ the pixel categorization process by specifying, to the computer algorithm, numerical descriptons of the various land cover and land use types present in a scene. To do this, representative sample sites of known cover type, called training area, are used to a compile a numerical ‘interpretation key’ that describes the spectral attributes for each feature type of interest. Each pixel in the data set is then compared numerically to each category in the interpretation key and labeled with the name of the category, it looks most like.
Use and Land Cover Change of Supervised Classification ‘1990‘
In this section Land Use Land Cover (LULC) maps of two years were compared. The LULC of the study area had changed dramatically during the period of 20 years. Therefore, the data interpretation and data analysis are based on the comparison of LULC for two different periods during the last 20 year period.
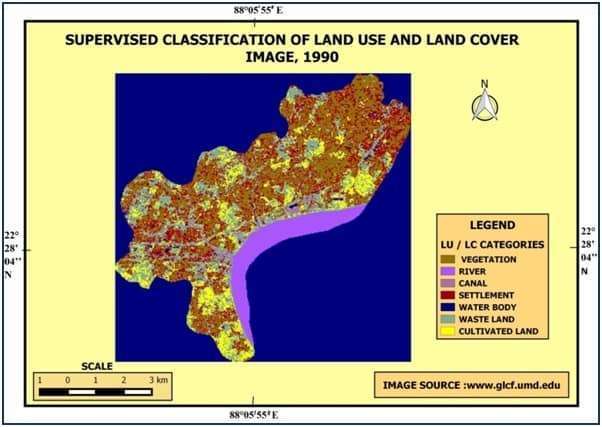
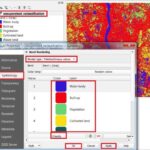
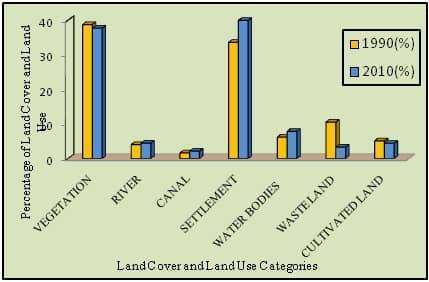
This area to show five land use and land cover categories, there are vegetation, settlement, water bodies, waste land and cultivated land. The result of supervised classification shows that there were seven main land uses in 1990 (map no. 6.1). It indicates that most of the area of the municipality was covered by vegetation (39 %). According to the classified map based on 1990 next to the vegetation cover, there was settlement, cultivated land and waste land played very important role in the study area.
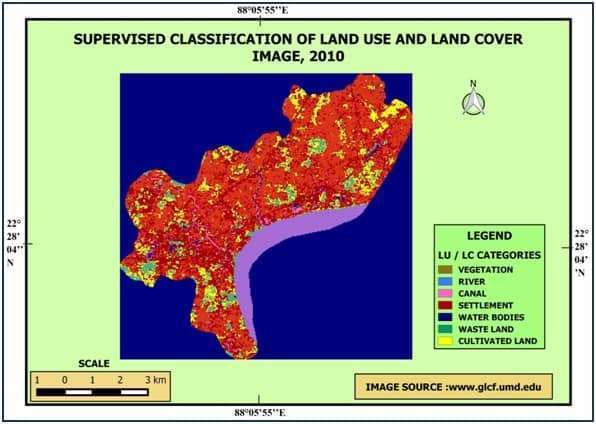
Land Use and Land Cover Change of Supervised Classification ‘2010‘
During the 20 year span in the Municipality settlement were prominently spread throughout the area (approx 40%). The vegetation cover, waste land and cultivated land losses were also accounted in the course of urbanization. Most of the waste land converted in the settlement remarkably.
Change Detection Analysis
The detection of changes involves the comparison between satellite imageries of 1990 and 2010. The method applied in this study is known as ‘image differencing’. The value of the pixels in 1990 image is simply subtracted from the value of the corresponding pixels in the 2010 image. Comparing the both images of the study area, conspicuous changes are recorded. Cultivated area and vegetation cover slowly reduce in the area due to increasing of built up area.

Show to Survey Questionnaire
Perception Survey Analysis
Uluberia Municipality area’s is a large amount of land use change in the last decade. This country is more developed of others countries, because this country is under municipal corporation and many facilities is there, then this is the intellect. In 20 years proper land use change in this area and constructions, marketing simultaneously increasing day by day. Therefore, in this chapter, perception survey about the alteration of land usage can be explained systematically.
Land Use Pattern
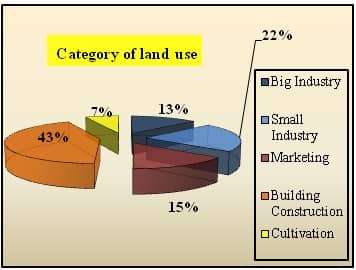
The micro level study represents that in Uluberia Municipality comprises five types of land use, such as big and small industry, marketing, buildings construction and cultivation.
The last 20 years the land use has totally changed in the study area, mainly building construction is more and also create to industry as well as nature of marketing. Therefore, in percentages where percentages the highest is building construction 43%, then small industry 22%, big industry 13%, marketing 15% and lower is cultivation, only 7% cover of the land. These areas most of people are saying to the replace wetland and waste land is Buildings, Industries and Marketing.
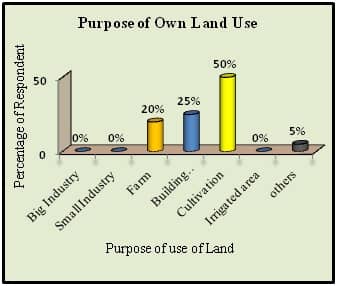
Purpose of Land Use
The diagram showing use of land in different types under to the Uluberia Municipality area’s people. Therefore, most of the people is own land use for cultivation almost 50%, farm 20% as well as buildings 25% and others(like waste land,wet land garden etc.) is only 5%, but no one persons do not use of your land is a big or small industries and irrigated land.
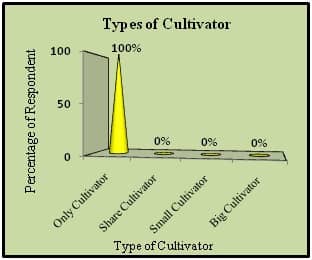
The diagram showing types of cultivator in percentages of only cultivator is 100% do not have share or big or small cultivator, because this area is more developed to the other surrounding area, so cultivation is very low amount, just some people are involved in cultivation, so that is the reason is 100% to only cultivation.
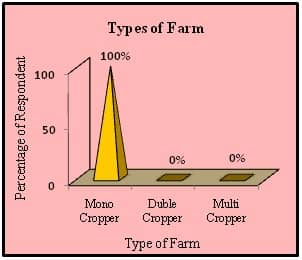
The diagram showing types of farm in percentages where the percentages of Mono cropper is 100%, Duble and Multi cropper 0%, it relates to the cultivation. Mono cropper is100% because the cultivation land is small, so mono cropper is totally 100%, do not have double and multi cropper.
Source of Irrigation for Cultivation
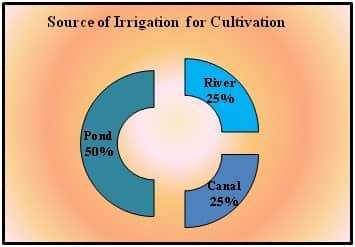
The diagram is showing source of irrigation for cultivation. Therefore, three types of irrigation sources, river, pond and canal. This area’s people more depend on the pond for cultivation, like that 50% and 25% depends on the river and the canal also.
Soil Analysis
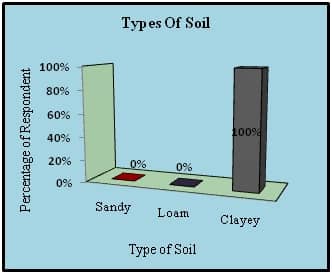
The diagram shows the types of soil in percentages where the percentage of clay 100%, sand and loam is 0%. Clayey is 100% because it is a part of Gnga delta.
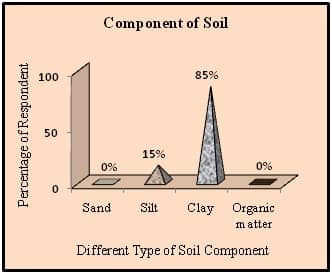
The diagram depicts the component of soil in Uluberia Municipality area. Therefore four types of soli component sand, silt, clay and organic matter, in percentages where the percentage of clay 85%, silt 15%, sand and organic matter is 0%, because it is a plain land so clay is high and river Hugli is there so small percentages of silt.
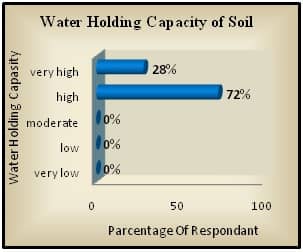
The diagram showing water holding capacity in this area soil. The highest percentage of respondents of this area people water holding capacity of the soil is high, there are 72% and also very high just 28%, because this area soil type is clay, so that is the reason other holding capacity of soil is very good.
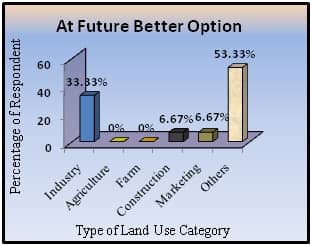
The diagram showing what type of categories in uluberia municipality area better option of the future. The most of people expect some others facilities in this area about 53.33%, industry is 33.33% and just some people say to construction as well as marketing is just 6.67%.
Survey Data Table