Esri Landsat Viewer App
In this lesson, explore Landsat imagery with the Esri Landsat app. Analyze vegetation, NDVI, Change Detection, Agriculture, Geology, and more.
Esri Landsat App
First, you’ll open the Esri Landsat Viewer app and become familiar with the notion of spectral band combination.
| Band | Name | What this band shows best |
|---|---|---|
| 1 | Coastal | Shallow water, fine dust particles |
| 2 | Blue | Deep water, atmosphere |
| 3 | Green | Vegetation |
| 4 | Red | Manufactured objects, soil, vegetation |
| 5 | Near Infrared (NIR) | Shorelines, vegetation |
| 6 | Shortwave Infrared 1 (SWIR 1) | Cloud penetration, soil and vegetation moisture |
| 7 | Shortwave Infrared 2 (SWIR 2) | Improved cloud penetration, soil and vegetation moisture |
| 8 | Cirrus | Cirrus clouds |
1. Open the Esri Landsat app.
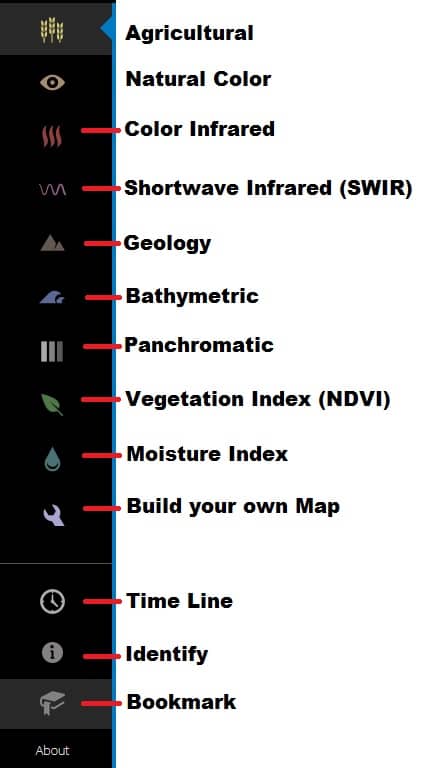
2. In the vertical toolbar on the left, hover over the currently selected Agriculture button, for highlights healthy agriculture vegetation.
3. In the toolbar, click Natural Color, and you can see that the imagery is dominated by earth-colored tones.
4. Click the Vegetation index tool and see the vegetation cover in your selected area.
5. Also you can try different tools, like moisture index, swir, panchromatic, geology, for your requirements.
6. You can use the Bookmark tool to save your project area.
Esri Landsat Explorer
Use the Esri’s new Landsat Explorer web app to visualize our planet and understand how the Earth has changed over the time. Now you can instantly analyze over 500,000 Landsat 8 and GLS scenes, offering global coverage with over 500 new scenes added every day. The app is free, with no download or installation required.
Quick access to the following band combinations:
- Agriculture: Highlights agriculture in bright green; Bands 6, 5, 2.
- Natural Color: Sharpened with 15m panchromatic band; Bands 4, 3, 2 +8.
- Color Infrared: Healthy vegetation is bright red; Bands 5, 4, 3.
- SWIR (Short Wave Infrared): Highlights rock formations; Bands 7, 6, 4.
- Geology: Highlights geologic features; Bands 7, 6, 2.
- Bathymetric: Highlights underwater features; Bands 4, 3, 1.
- Panchromatic: Panchromatic images at 15m; Band 8.
- Vegetation Index: Normalized Difference Vegetation Index (NDVI); (Band 5 – Band 4)/ (Band 5 + Band 4).
- Moisture Index: Normalized Difference Moisture Index (NDMI); (Band 5 – Band 6)/ (Band 5 + Band 6).
- SAVI (Soil Adjusted Veg. Index): Offset + Scale* (1.5* (Band 5 – Band 4)/ (Band 5 + Band 4 + 0.5)).
- Water Index: Offset + Scale* (Band 3 – Band 6)/ (Band 3 + Band 6).
- Burn Index: Offset + Scale* (Band 5 – Band 7)/ (Band 5 + Band 7).
- Urban Index: Offset + Scale* (Band 5 – Band 6)/ (Band 5 + Band 6).
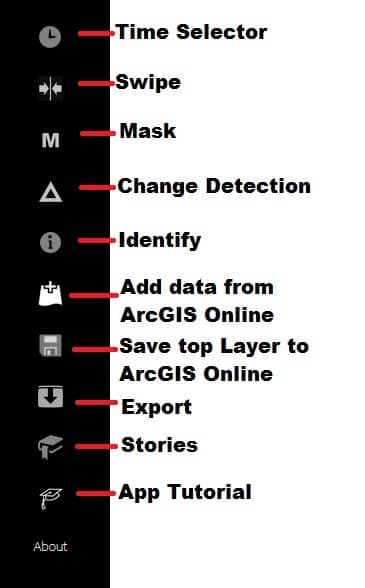
How to use Landsat Explorer
Landsat Explorer app helps you to Analyze Change Detection, ArcGIS Online data access, Export, and more.
The Landsat view opens in Natural Color. Zoom in this view, you can clearly see the bridges, highways, rivers, and concentrated developed land, etc.