Change Detection in Remote Sensing using Erdas Imagine
In this Tutorial, Learn Change Detection in Remote Sensing using Erdas Imagine Software.
What is Change Detection?
Change Detection is a process that measures a particular area that has changed between two or more periods. It has been widely used to evaluate shifting agriculture, deforestation, urban growth, the impact of natural disasters like tsunamis, earthquakes, and land use/cover changes, etc.
Change Detection using Erdas Imagine
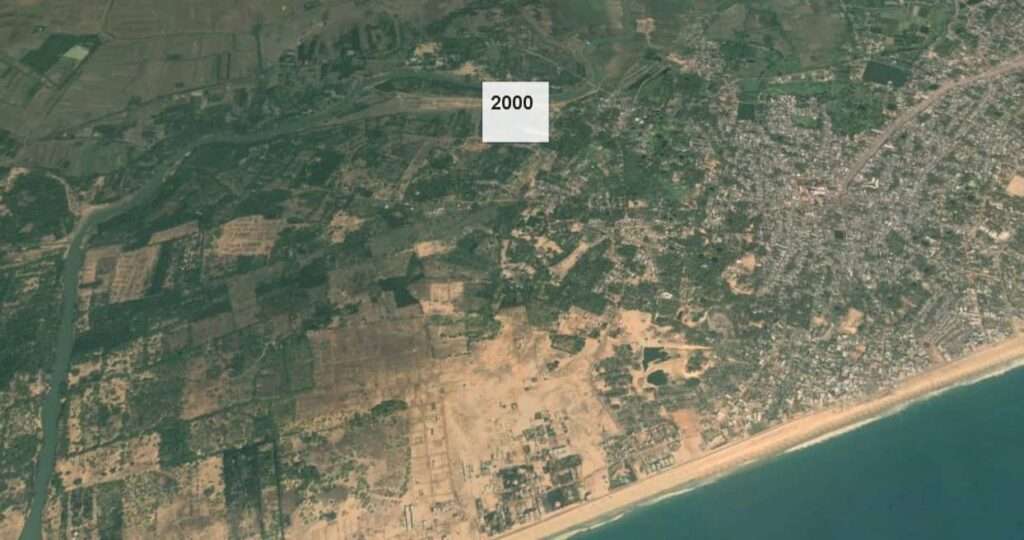
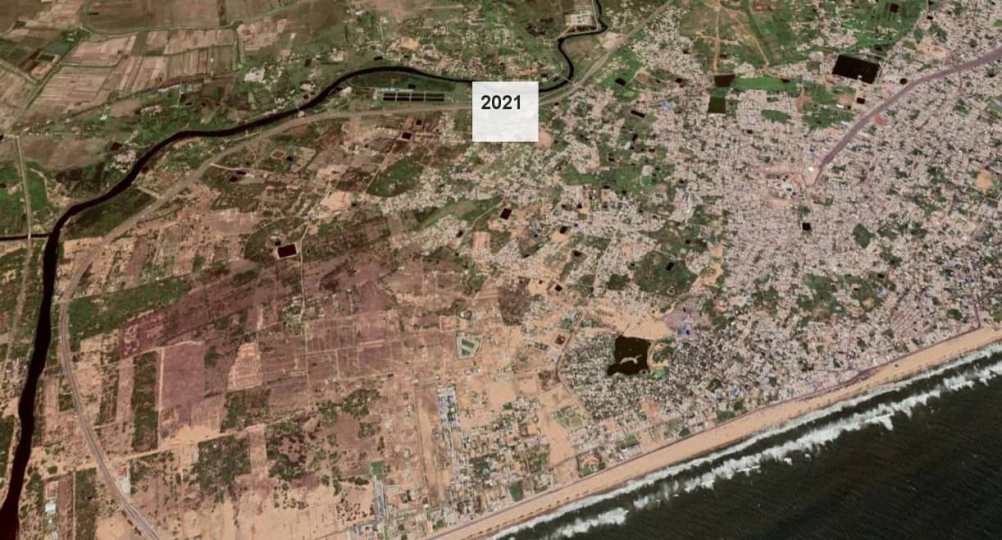
Start Erdas Imagine Software, and open 2 images from different years (this 2 images gap between 30 years).
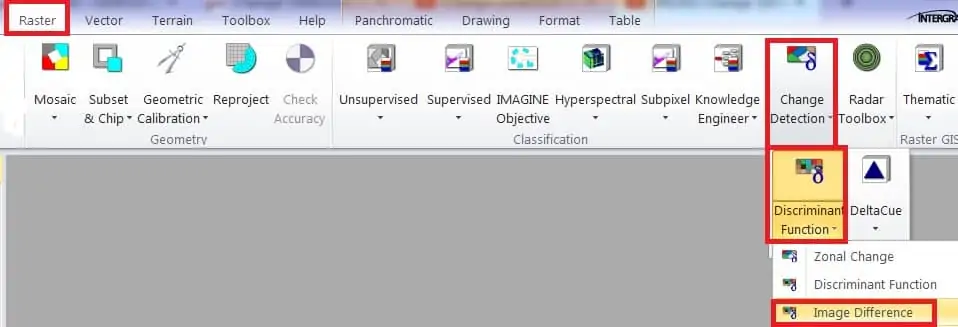
Now open the Change Detection (Image Difference) Toolbar. Select Raster Tab in Menu bar > choose Change Detection click Change Detection > Image Difference click Image Difference > select Image Difference
Change Detection Process
Change Detection (Image Difference) Window appears, follow the process step by step.
Browse old images and new images in the same area.
(i) In the Before Image box, select the old image, and After Image box, select the recent image.
(ii) Now select the Output, browse your destination folder and write the File name. Two output file is available: a) Image Difference file and (b) Highlight change file.
(iii) You can change, Increase, or Decrease change detection percent (Default 10%).
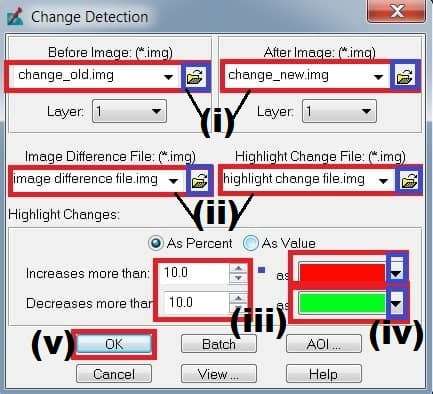
(iv) Also, you can change the Color combination to Understand, How much percent of area Decrease or Increase in Land use.
(v) Finally, click the OK button, to complete this process.
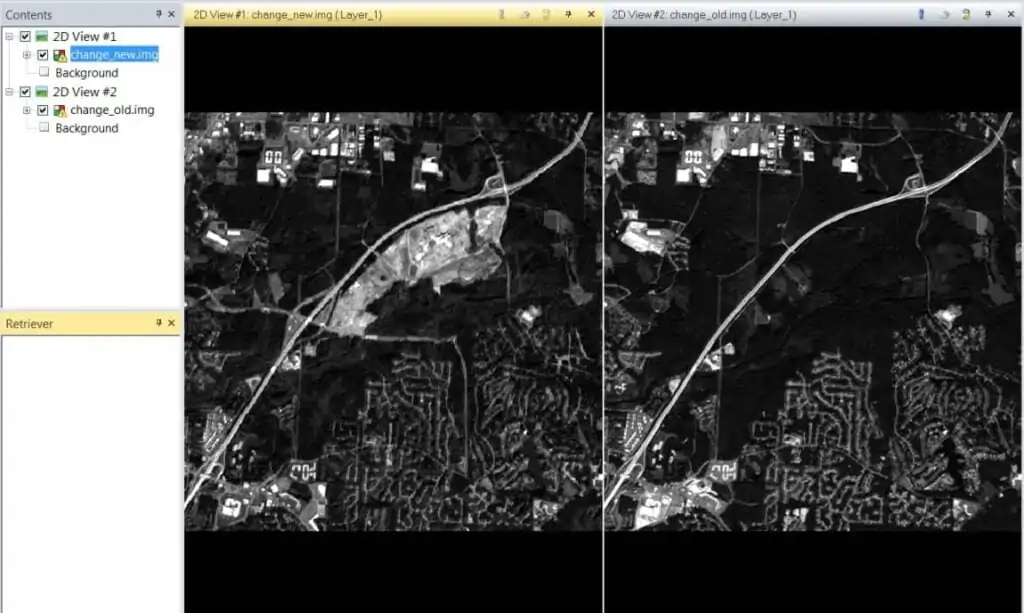
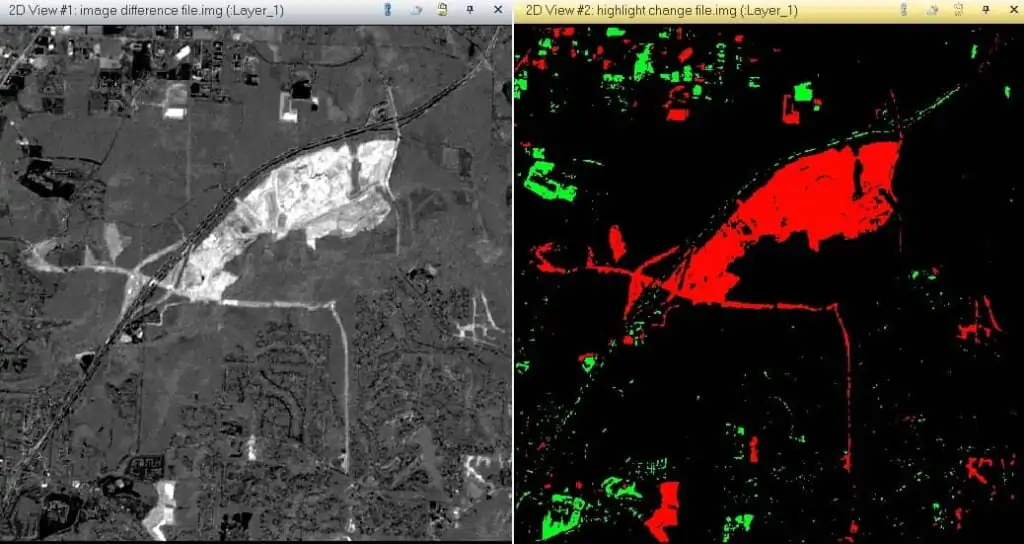
Now open 2 windows in Erdas Imagine side by side, and open 2 images (1) Image Difference image (2) Highlight change image.
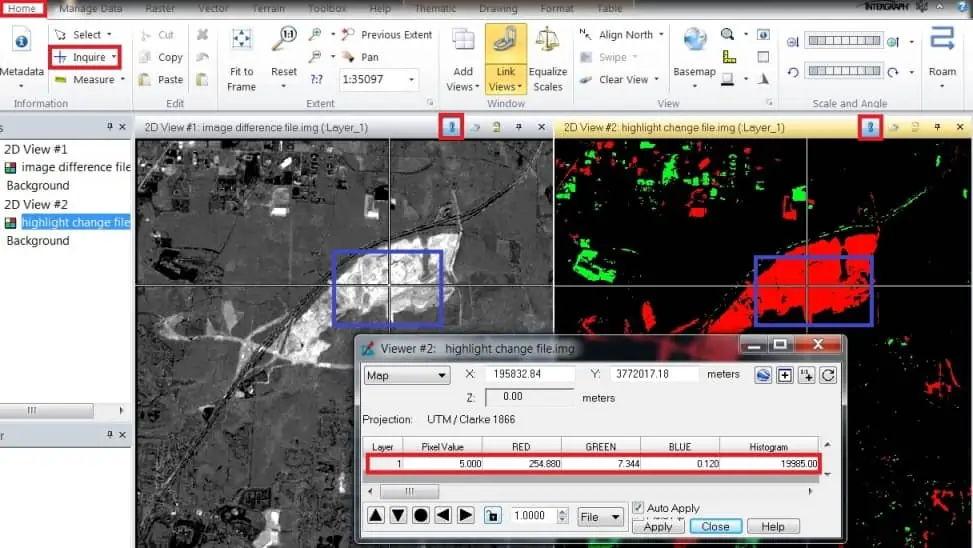
To better understand two images, link image, and open the Inquiry Toolbar.
Now open Highlight change image Attribute Table.
Right click Highlight change image and select Display Attribute Table.
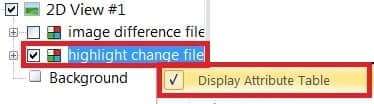
Attribute Table window appears, change color and proper define Change Detection.
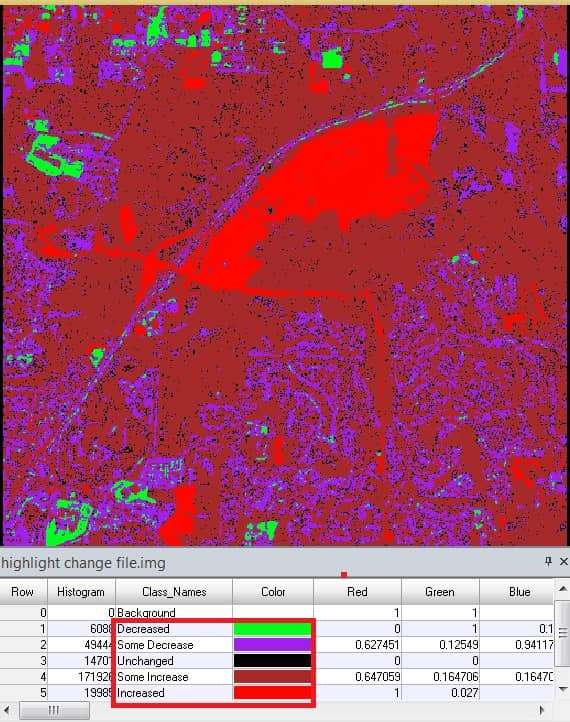
Interpretation Change Detection
In this change detection image, the Green areas represent to Maximum Decrease the land use. The Purple areas represent some Reduction of land use. The Black portion is defined as Unchanged land use, it’s not Increased or Decreased. The Brown areas represent to Partially change this area. Similarly, the Red areas represent Maximum Increase land use.