Spectral Signature/Signal in Remote Sensing
What is Signature/ Signal?
A signature is a set of data that defines a training sample, feature space object, or cluster. The signature is used in a classification process. Each classification decision rule requires some signature attributes as input—these are stored in the signature file (.sig). Signatures in Erdas Imagine can be parametric or non-parametric.
A spectral signal refers to the distribution of energy or intensity of a signal across different frequencies or wavelengths. In the context of remote sensing, spectral signals are used to represent the reflectance or emittance of various materials, such as vegetation, water, and soil, across different bands of the electromagnetic spectrum.
Types of Signature
Parametric Signature
A parametric signature is based on statistical parameters of the pixels that are in the training sample or cluster. A parametric signature includes the following attributes in addition to the standard attributes for signatures:
- Number of bands in the input image
- Minimum and maximum data file value in each band for each sample or cluster
- Mean data file value in each band for each sample or cluster
- Covariance matrix for each sample or cluster
- Number of pixels in the sample or cluster
Non-parametric Signature
A non parametric signature is based on an Area Of Interest (AOI) that you define in the feature space image for the image file being classified. A non-parametric classifier uses a set of non-parametric signatures to assign pixels to a class based on their location, either inside or outside the area in the feature space image.
What is Spectral Signature?
Spectral signature is the signal to reflectance or emittance of a material with respect to wavelengths. The spectral signature of an object is a function of the incidental Electromagnetic wavelength and material interaction with that section of the Electromagnetic spectrum.
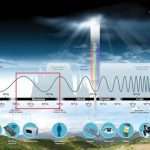
Different surface types, such as water, vegetation, build up, land, reflect radiation differently in various channels. The radiation reflected as a function of the wavelength is called the spectral signature of the surface.
Signature Editor
Follow the step, how to collect signature, and Signature Editor task.
Signature mean plot
Once you have complete Signature Editor task, open the signature mean plot window.
The dialog enables you to view the mean of the signal signature or all signatures in all bands of the image to be classified.
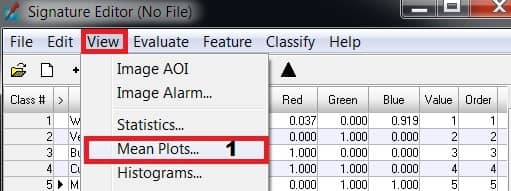
1. Select View > Mean plots, in the menu bar or click icon in the toolbar of the signature editor dialog. The Signature mean plot dialog open.
2. Click in the Signature mean plot dialog to show the mean plot for the current signature.
3. Click in the Signature mean plot dialog to show the mean plot for all the signatures.
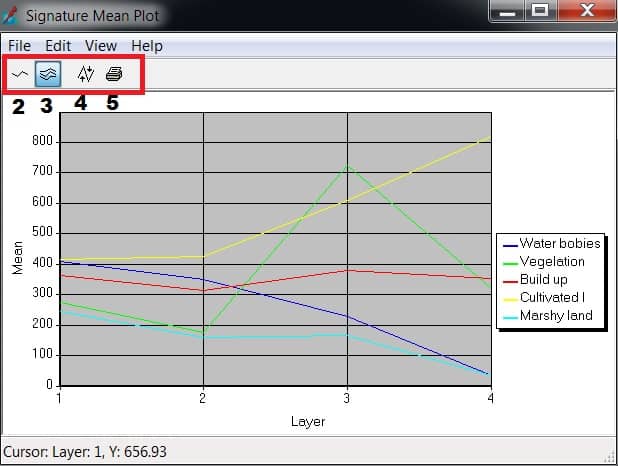
4. Click in the Signature mean plot to adjust the range of values shown in the ‘Y’ axis to show the smallest range possible to reflect the values of the currently plotted signature.
5. You can also print this diagram, to click the print button.