ArcGIS Velocity
What is ArcGIS Velocity?
ArcGIS Velocity is the real-time and big data processing and analysis add-on capability for ArcGIS Online. It allows you to import, visualize, analyze, store, and use data from Internet of Things (IoT) sensors.
It also helps users process, visualize, and analyze real-time data feeds; store those feeds as big data; and perform fast queries and analysis.
You can also design analytic models to process high-volume historical data and gain insights into patterns, trends, and anomalies.
Key Features
- Real-Time Data Ingestion
- Integration with ArcGIS Online
- Stream & Big Data Analysis
- Event-Driven Workflows- ArcGIS Notebooks, Webhooks, or ArcGIS Dashboards.
Usage
You can use Velocity for the following types of workflows:
- Connect to IoT systems and visualize sensor observations.
- Create a geofence around an area of interest to detect the spatial proximity of events.
- Process data faster than with your existing tools and workflows.
- Enrich and filter observations to focus on the most interesting event data.
- Manage data in real time as a service.
- Explore data to identify important patterns and trends.
- Use spatial statistical analysis and machine learning tools suitable for large datasets.
- Use cloud solutions instead of managing a multi-machine deployment for real-time and big data use cases.
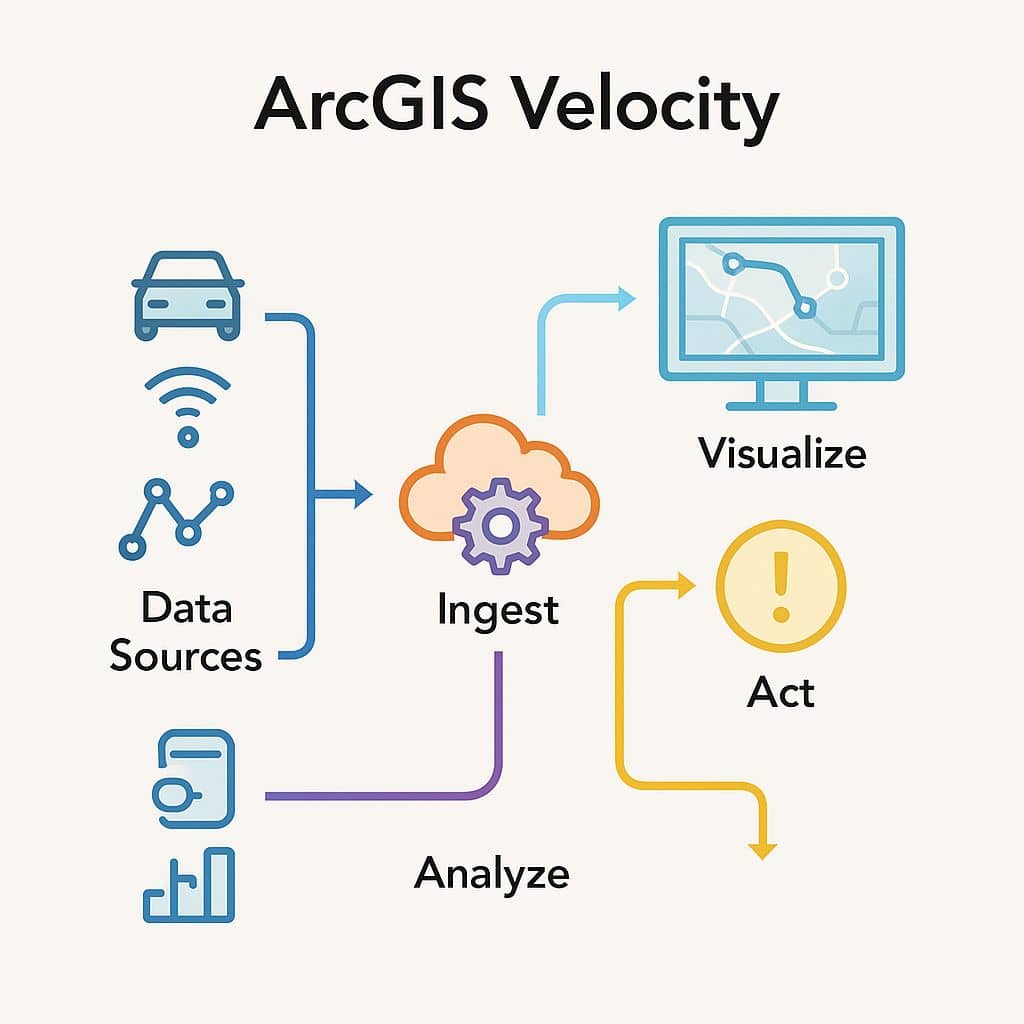
How Velocity Works?
ArcGIS Velocity works with vector and tabular data and can receive real-time observations over HTTP, connect to IoT cloud providers such as Azure and Cisco, or consume from Kafka, MQTT, RabbitMQ, and other messaging technologies.
- Connect: Connect to real-time, streaming IoT data from multiple feeds and visualize directly in maps.
- Analyze: Speed up your analysis and get answers faster when you set up analytical models in the cloud.
- Alert and actuate: Take action with your analyses. Share the results and alert stakeholders when it matters.
How do you get access Velocity?
To get access to Velocity, you’ll need a Velocity license for your ArcGIS Online subscription, which includes enough compute and storage capacity for multiple tracking and monitoring use cases.
Get started with ArcGIS Velocity
You must have an ArcGIS Online account with access to ArcGIS Velocity.
Access the Velocity Application
1. open the ArcGIS Velocity app.
2. Sign in your ArcGIS Online credentials.
Explore and create feeds
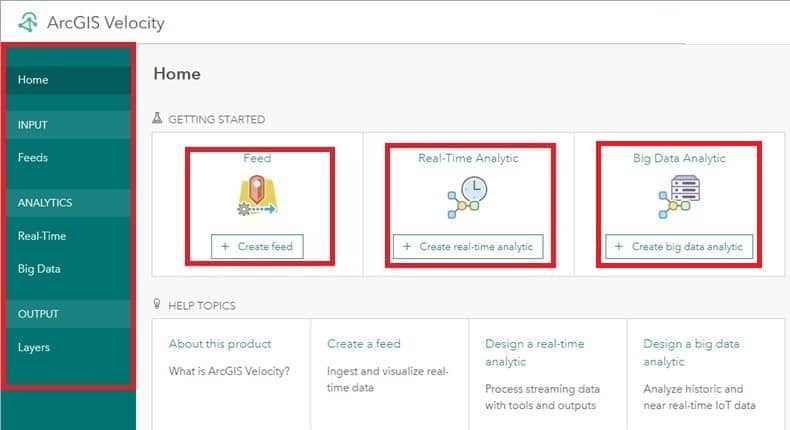
Once you’re signed in, the Velocity home page appears.
1. From the main menu on the left, click Feeds under INPUT.
2. On the Feeds page, click Create feed.
3. Close the Select a feed type window.
Explore and create analytics
1. From the main menu, click Real-Time under ANALYTICS and explore the Real-Time Analytics page.
2. Click Create real-time analytic.
3. Click Existing feed to select an existing feed from your organization.
4. In the Select existing feed window, click the My Content drop-down menu and choose My Organization.
5.Click Confirm.
6. Click Cancel to close the real-time analytic editor and return to the Real-Time Analytics page.
7. From the main menu, click Big Data under ANALYTICS and explore the Big Data Analytics page.
Continue exploring Velocity with the Create a feed, Design a real-time analytic, and Design a big data analytic quick lessons.