ArcGIS Dashboards
Dashboards are visual displays that present data visualizations in an easy-to-read format. All relevant information can be seen on a single screen, facilitating understanding quickly and easily.
What is ArcGIS Dashboard?
ArcGIS Dashboards to help monitor status in real time, essential information products, like maps and apps, providing a critical component to your Geo-spatial infrastructure.

Dashboards offer location-based analytics using intuitive and interactive data visualizations at a glance. These few of months, ESRI has been working around the story of great data being a cornerstone of every great dashboard.
Dashboard data expressions are simply an arcade expression that returns a feature set. Using this expression, language authors can reconstruct data sets to power of any dashboard elements, and in turn those elements can help form an engaging and informative dashboard.
Types of Dashboards
There are many types of dashboards you can build with ArcGIS Dashboards.
- Strategic
- Tactical
- Operational
- Informational
ArcGIS Dashboard Tutorial
To create a dashboard, follow the steps:
Before you create a dashboard, verify that you are Signed in to ArcGIS Online web portal.
1. Click the app launcher button ![]() or Launch ArcGIS Dashboards in the header of the site.
or Launch ArcGIS Dashboards in the header of the site.

2. Click Create dashboard, and write the title for the dashboard.
Add Elements
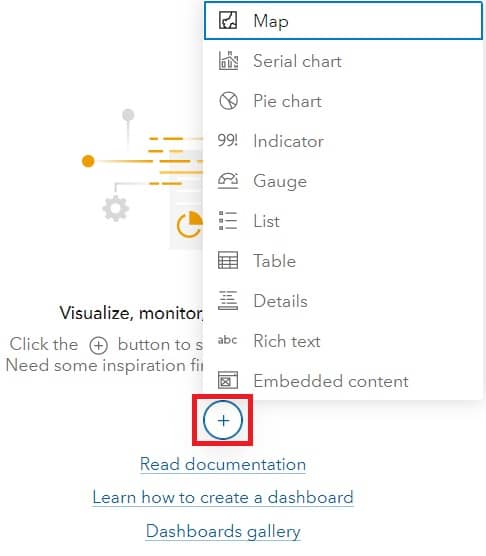
1. From the empty dashboard, click the Add element button ![]()
2. Choose an element from the drop-down list. (configure your element)
3. Once you have configuration is complete, click Done.
4. After you add an element to a dashboard, appear in the layout panel.
You can click the Options button. From the options menu, you can choose one of the following:
- Configure

- Duplicate
- Rename

- Delete
Create a Dashboard
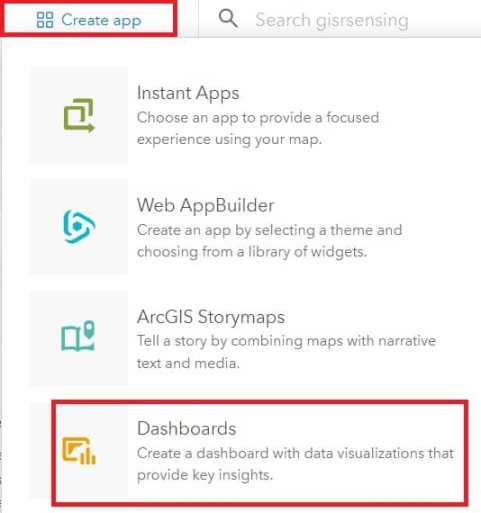
1. Click Create App then choose Dashboards.
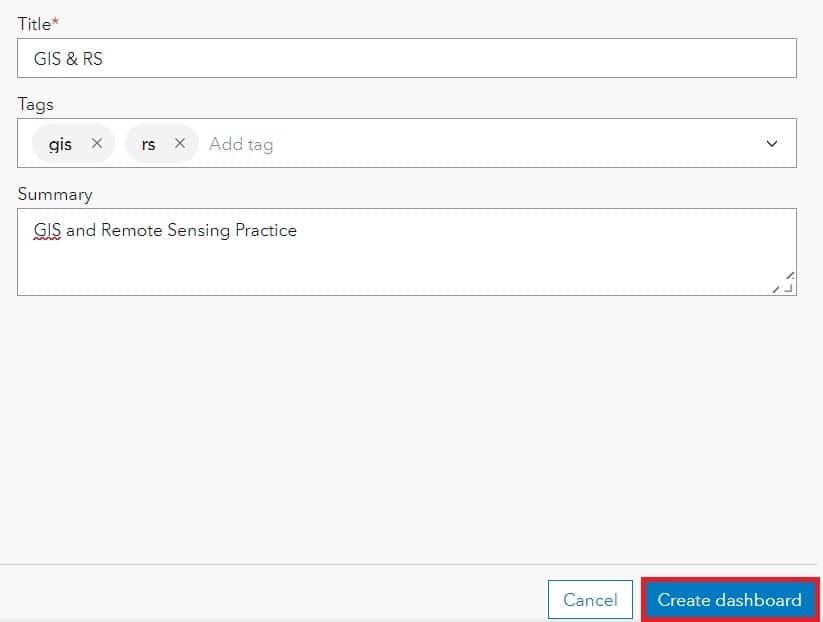
2. Enter the required information, like Title, tags, summary, etc. When all the fill completed, Click Create dashboard for finished.
Setting the Map Element
1. In the upper left corner of the map, to display a black bar. Move your mouse over the bar to reveal the menu. You can access all of an element’s settings via this menu.
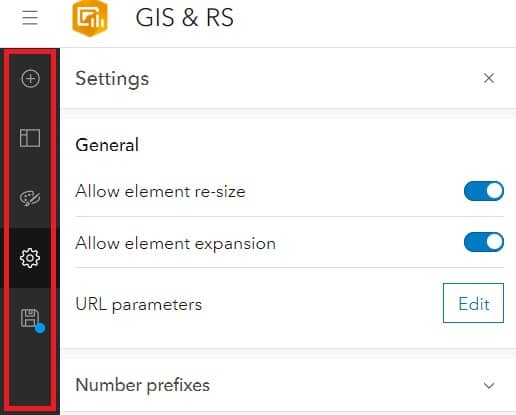
2. Click the Plus button, and your project’s requirement features.