ArcGIS Geostatistical Analyst
Introduction
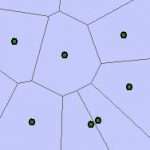
ArcGIS Geostatistical Analyst, you can easily create a continuous surface, or map, from measured sample points stored in a point feature layer or raster layer or by using polygon centroids.
These are especially helpful for atmospheric data analysis, petroleum and mining exploration, environmental analysis, precision agriculture, and fish and wildlife studies.
ArcGIS Geostatistical Analyst extension
The Geostatistical Analyst extension provides the capability for surface modeling using deterministic and geostatistical methods.
The tools it provides are fully integrated with the GIS modeling environments and allow GIS professionals to generate interpolation models and assess their quality before using them in any further analysis.
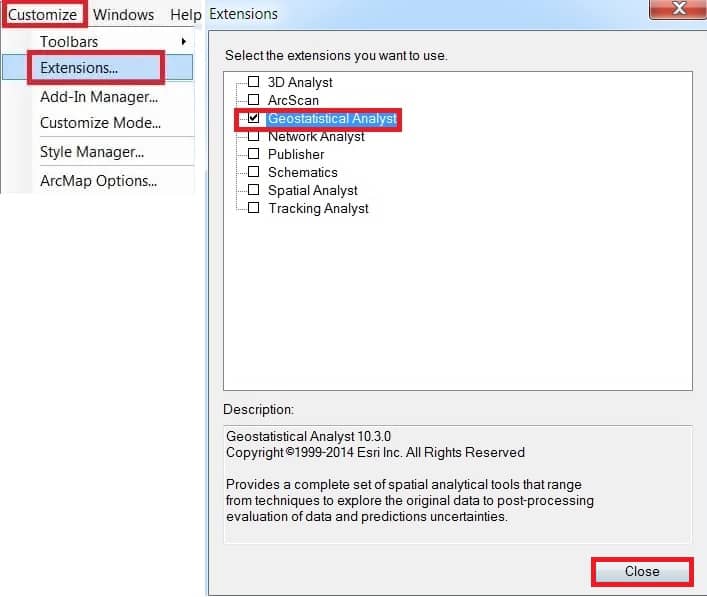
How to Enable Geostatistical Analyst extension
Enabling Geostatistical Analyst extension, Click the Customize menu, and select Extensions. In the Extensions dialog box, Check Geostatistical Analyst to enable it and close the dialog box.
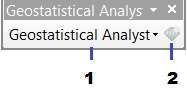
How to Add Geostatistical Analyst Tool
Enabling the Geostatistical Analyst toolbars, Click Customize menu, Point to Toolbars, select Geostatistical Analyst.
- Geostatistical Analyst Options
- Geostatistical Wizard
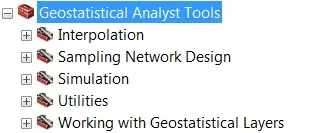
Geostatistical Analyst tools into five toolsets:
Geostatistical Analyst Tutorial
In this tutorial creating a model using default parameter values to generate a surface of rain concentration.
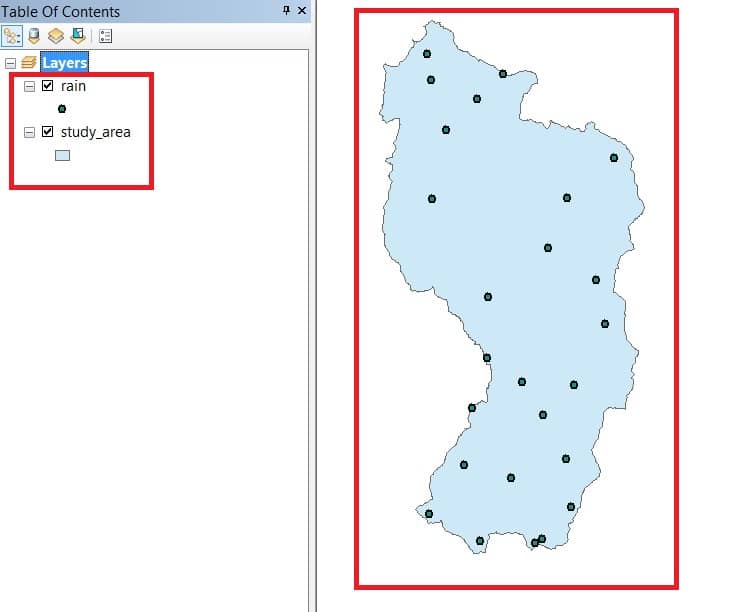
Add Data in ArcMap
Steps:
1. Click the Add Data button on the Standard toolbar.
2. Navigate to the folder where you installed the tutorial data (rain, and study_area)
3.Now Click Add the data.
4. In the Layer Properties dialog, click the Symbology tab.
5. Show the dialog box, click Quantities and then Graduated colors.
7. In the Fields dialog box, set the Value to avarage_rain.
8. Choose the color ramp as you want.
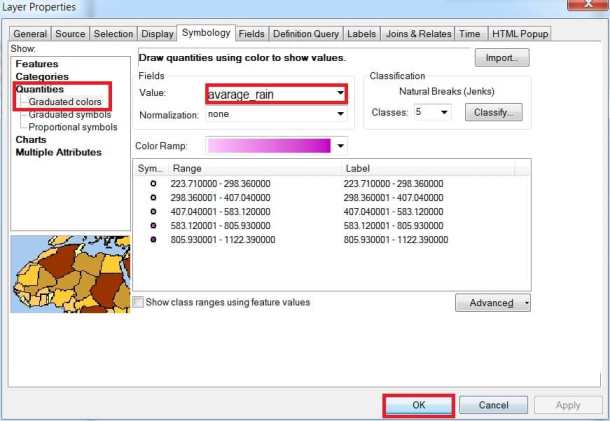
9. Finally click OK.
Create a Surface using the default options
Steps:
1. Click the Geostatistical Analyst arrow on the Geostatistical Analyst toolbar and click
Geostatistical Wizard.
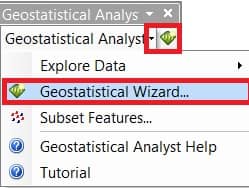
The Geostatistical Wizard dialog box appears.
2. Click Kriging/CoKriging in the Methods list box.
3. Click the Source Dataset arrow and click ‘rain’.
4. Click the Data Field arrow and click the ‘jun’ attribute.
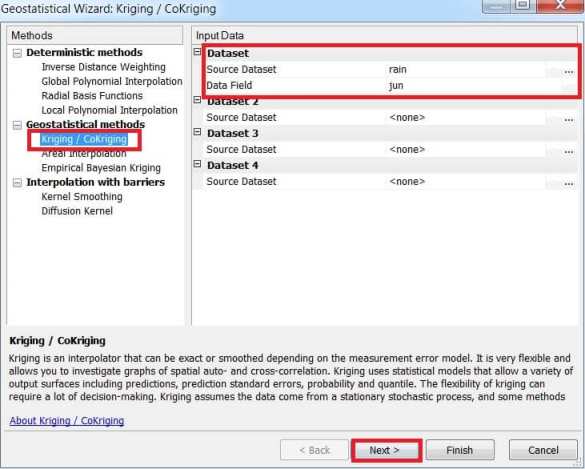
5. Click Next.
By default, Ordinary (kriging) and Prediction (map) are selected on the dialog box.
6. Click Next.
The semi-variogram/covariance model is displayed, allowing you to examine spatial relationships between measured points.
7. Click Next.
The crosshairs show a location that has no measured value. To predict a value at the crosshairs, you can use the values at the measured locations.
8. Click Next.
The cross-validation diagram gives you an idea of how well the model predicts the values at the unknown locations.
9. Click Finish.
The Method Report dialog box summarizes information on the method that will be used to create the output surface.
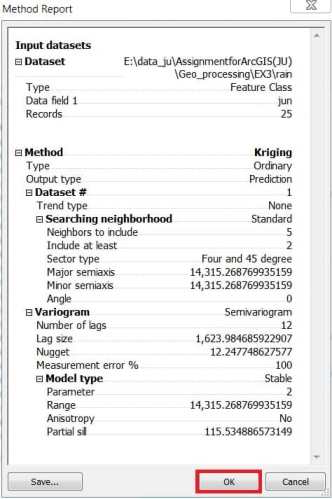
10. Click OK.
The predicted rain map is added as the top layer in the table of contents.
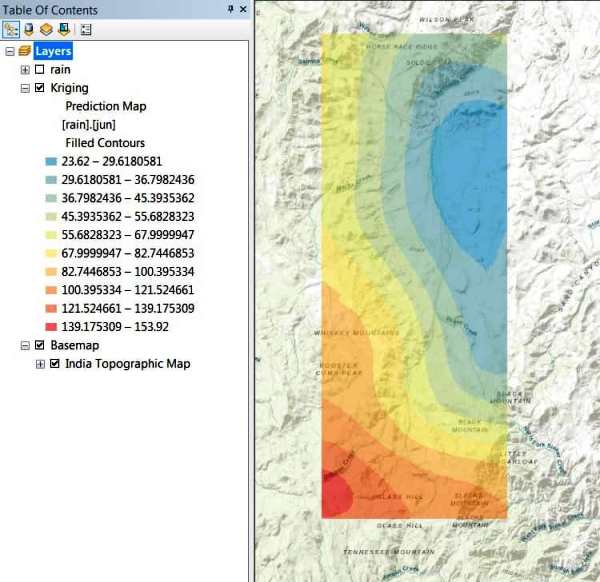
You can also add the Basemap to better understand Geostatistical Analysis with location.