Introducing ArcGIS Pro – Advanced Mapping and Analysis
In this tutorial, you’ll learn the main components of the ArcGIS Pro user interface—the Ribbon, Views, and Panes.
What is ArcGIS Pro?
ArcGIS Pro is the latest Professional desktop GIS application from ESRI. Its supported data visualization, advanced analysis and authoritative data maintenance in both 2D and 3D.
Features:
- Cartography and Visualization
- Integrate data from multiple sources
- Visualize your data
- Edit and analyze your data
- Share your work with the world
Extensions:
Advanced Analysis
Data & Workflows
Download ArcGIS Pro
ArcGIS Pro is the latest professional desktop GIS application. Download ArcGIS Pro from My Esri.
ArcGIS Pro Online
Open ArcGIS Pro and confirm you are signed into your ArcGIS Online account. If the ArcGIS Sign in window appears, enter your ArcGIS organization username and password and click Sign in.
Start ArcGIS Pro
You can Create and Open project on the Home tab. Find tutorials and other help information on the Learning Resource tab, and set options for ArcGIS pro on the Settings tab.
User Interface
ArcGIS Pro allows to store multiple items, such as maps, layouts, tables, and charts, in a single project and work with them as needed.
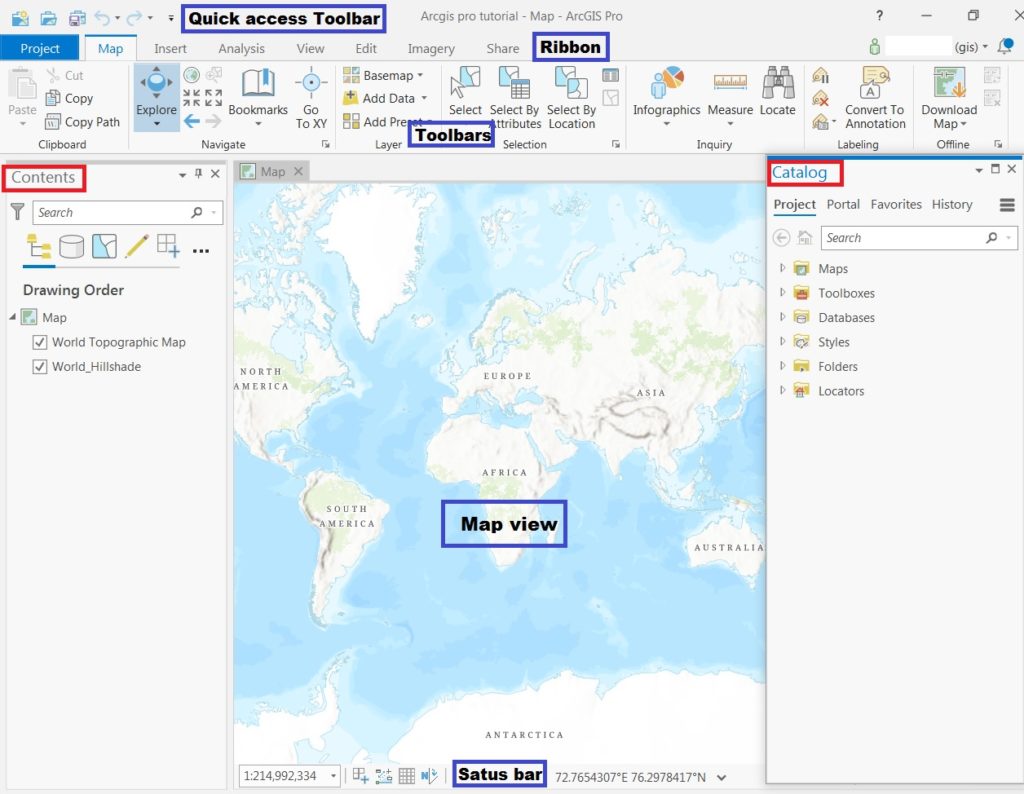
Quick Access Toolbar
At the top of the application is the Quick Access Toolbar. This is where you can save your project and undo or redo actions.
The Quick Access Toolbar, located above the Ribbon, has commonly used for commands.
| Command name | Icon | Shortcut keys |
|---|---|---|
| New Project |  | Ctrl+N |
| Open Project |  | Ctrl+O |
| Save Project |  | Ctrl+S |
| Undo |  | Ctrl+Z |
| Redo |  | Ctrl+Y |
Ribbon
Below the Quick Access Toolbar is the Ribbon which consists of the series of tabs. Each tab, such as the Map tab, has its own setup commands.
Certain tabs, referred to as core tabs, are either always visible or appear when a specific type of view is active. For example, the Map tab is present whenever a map view is active.
Other tabs, called contextual tabs, are present when a certain type of layer or feature with specific properties is selected in a map. For example, when you select a feature layer in the Contents pane, the Feature Layer, Labeling, and Data tabs appears.
Toolbar
These are different Tools and Toolbars, available in ArcGIS Pro, including:
- The Standard Toolbar has a wide range of commands, like Open and Save map document, Cut, Copy, and Paste, Undo, Redo, Add Data, Editor, etc.
- The Tools Toolbar provides interactive tools to Zoom In, Zoom Out, Pan, zoom to Full Extent, select features, Clear Selection, Identify, Measure, and Find.
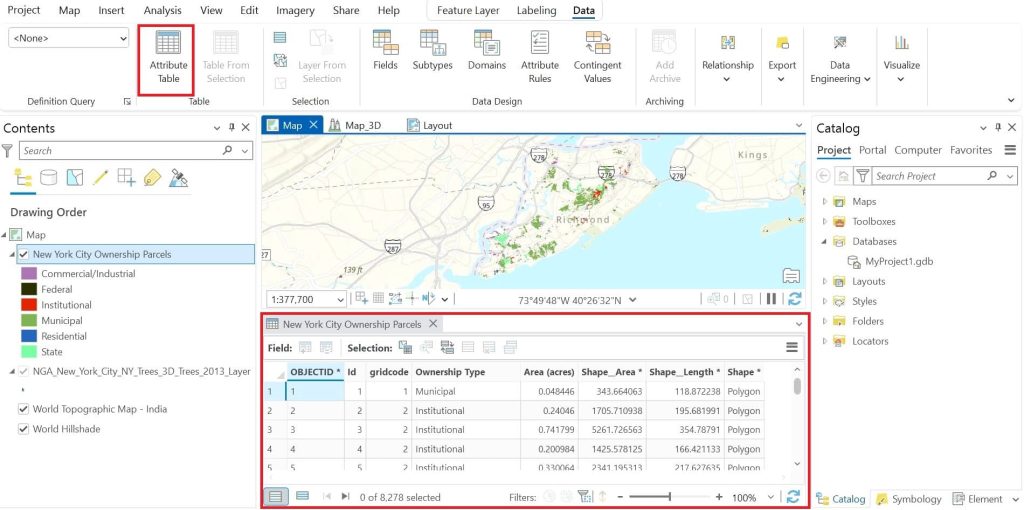
Views
The project opens to an ownership parcels map of New York city. This Project has a number of views open. A view can display a map layout table chart or another item. This project currently has two map views a local scene view and a layout view open.
Map View
Map Views are windows for working with maps, scenes, tables, layouts, charts, reports, and other presentations of data.

Click the view tab of the New York city ownership parcels map to make it active. The map shows ownership in the city.
Navigate Map
On the map tab in the navigate group the explorer tool is selected by default. The Explorer tool is a split tool. Clicking the top half performs in action which in this case is getting information about map features. The bottom half opens a drop-down list of choices that adjust the tools behaviour. When the explorer tool is selected you can navigate the map by panning and zooming. Hover over the New York city map. Notice that the mouse pointer changes to a hand. You can click and drag the map to pan it. If you pan too far away it can no longer see your study area you can use bookmarks to return to your starting place.

On the Map tab in the navigate group click bookmarks. Under New York city bookmarks click New York to return the map to its original extent. Click fix zoom in a few times to zoom into a larger scale and see more detail. You can use fix zoom out to zoom back out. As you zoom noticed that the map scale changes in the scale box at the bottom of the view. Click the map scale box drop down arrow and change the scale to 1 to 50,000. You can also zoom to see the entire extent of the layer. In the contents pane right click the city boundary layer and click zoom to layer to see the entire city boundary. On the map click anywhere inside the city boundary to open the pop-up pane. The pop-up pane contains information on the zoning layers attributes in the location you clicked. By default, the explorer tool opens pop ups for the topmost layer. Click close on the pop up. The information that appears in pop ups for features in the layer is stored in an attribute table. There is a one-to-one correspondence between features on the map and records on the table.
3D View
Let’s explore how to navigate around a 3D scene. Click the New York city NY trees 3D scene view to make the scene active. On the Map tab open bookmarks and under New York city 3D bookmarks, click your Jervois key. Back in the bookmarks click view from Lampton harbour to view the scene from another perspective. Drag the seam to pan in any direction. Similar to the map view on the map tab you can click fix zoom in and fix zoom out.

You can also use the mouse wheel to zoom in and out. There is an on-screen navigator which can be particularly helpful if you are not using an external mouse. Hover over the Navigator and click show full control. Drag the central sphere to look around in all directions from a stationary point of view. Drag the inner ring up and down to tilt the scene and left or right to rotate the scene. If you get disoriented, you can always return to one of the New York city 3D bookmarks. Click the show heading button to restore the Navigator to its default appearance.
Layout View
The Map tab on the ribbon is replaced by the layout tab. Make the New York City ownership parcels map view active again. Click the close button on its view tab.
When a layout view is active the content pane displays the layout page elements, such as main frames, legends, scale bars, and text.
The last thing we’ll do is make changes to a layout legend. Click the New York City ownership parcels layout to make the layout view active. A layout includes one or more map frames, representing maps or scenes in your project; map surround, such as legends, scale bars, and north arrows, text and sometimes pictures or graphic elements.

The contents pane the layout elements the map frames the legend the text elements and so on. By default, the elements are listed in their top to bottom drawing order, but we can use the graphic tabs at the top of the contents pane to organise them in different ways. Click list by element type to group the layout items by elements such as legends map frames and text. Click list by map frame and expand the two map frames. Here we can see the layers in each map and the map surrounds associated with each map frame. Click list by drawing order to return to the default grouping.
Let’s add a border to the legend to help it stand out on the layout. Right click legend and open its properties. The element pane appears with properties and settings for the legend. At the top of the pane on the legend tab click the drop-down arrow and select border. On the simple tab click the colour drop down arrow and set it to grey 40%. Increase the line with two points and apply the changes. At the top of the pane click the layers tab. Expand offset effect increase the offset to five points and click apply. Click the layout name at the top of the drawing order to deselect the legend.
Panes
A pane is a window that displays in ArcGIS Pro application, the Contents pane (contents of a view), and the Catalog pane.
Some functionality Panes are Symbology pane, Geoprocessing pane, Create Features pane, and so on.
The Contents and Catalog panes are usually open in a project. Other panes appear in response to commands or actions.
Catalog
The catalog pane provides access to data and other items used in the project.
If map view closes but it isn’t deleted from the project. To open it again go to the catalog pane and expand the maps container. You can right click the New York City ownership parcels map and click open to work with it again.
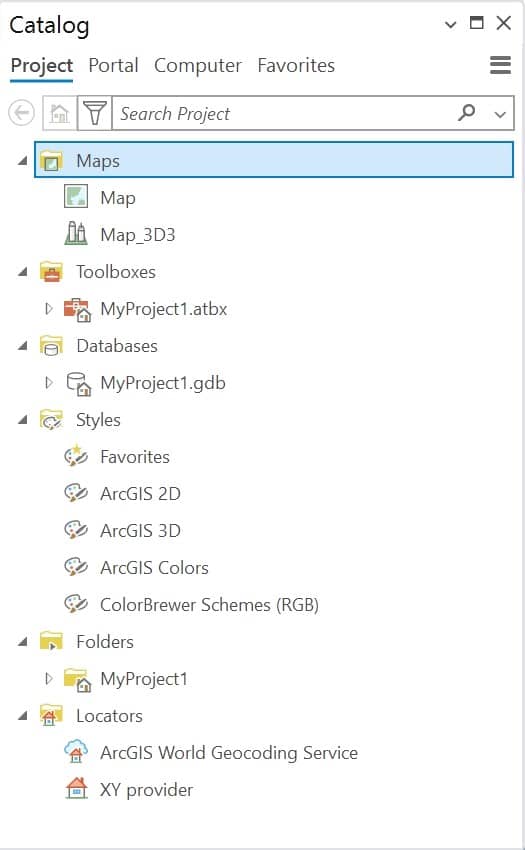
Contents
The Contents pane shows the contents of the active view.
If you accidentally close the contents and catalog panes you can reopen them on the View tab, by clicking reset panes for mapping (default) or by clicking catalog pane or contents to open just one of the panes.
In the contents pane click the zoning layer to select it. On the Ribbon three tabs are outlined in white. These are contextual tabs which appear when ArcGIS Pro is in a state to make use of them. For example, when a future layer is selected in the contents pane of a map as it is now, the Feature layer, Labeling and Data tabs appear and contain commands for working with feature layers.

Attribute Table
On the Ribbon, click the data contextual tab and, in the Table group, click Attribute table. The layers attribute table open in a View. Each row on the table corresponds to a feature in the layer. Each column is an attribute or a category of information. By default, the table view is docked below the map which may partially block your view of the map. You can drag the table view by its view tab away from its docked position. As you drag the view over the application window its position is represented by a semi-transparent blue rectangle. If you hover over the map docking targets appear. Drag the table view to a location that is not on a docking target and release the mouse button to float the view over the application window.
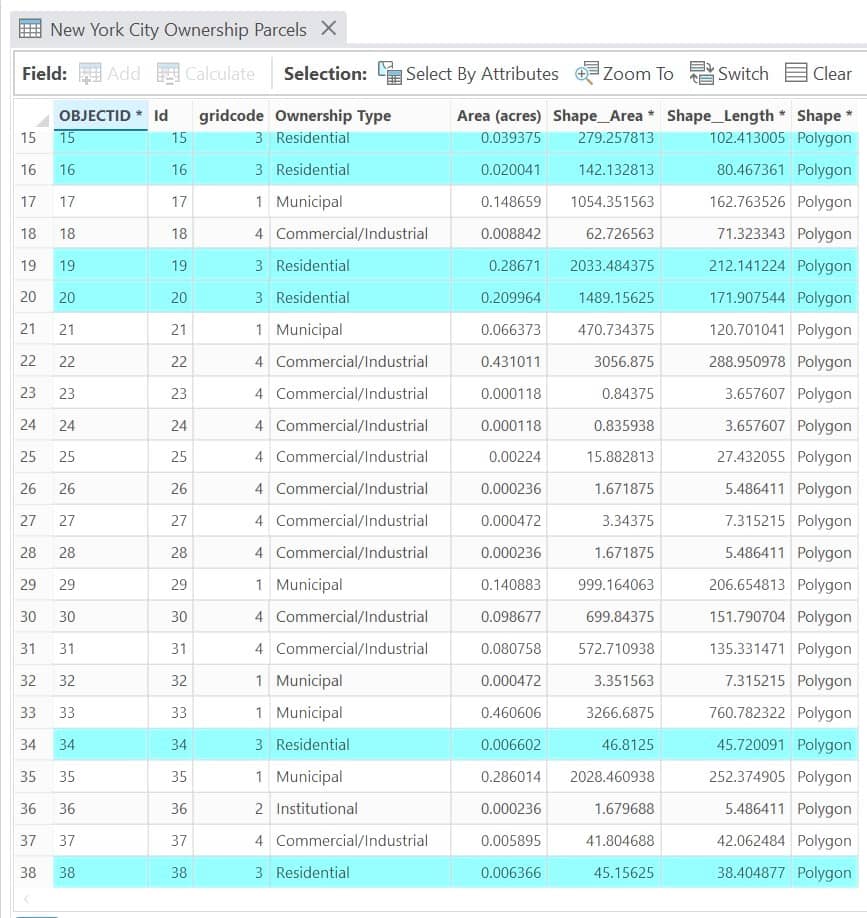
You can move and resize the table to fit your needs. In the table click the grey Square numbered one at the edge of the table to select the first row. The row is highlighted in the table and its corresponding feature which is part of New York City ownership. You could scroll through the table and select them manually but there is a better way on the map tab click select by attributes to open the select by attributes window.
Feature Attributes
Let’s create a query to select the conservation features on the map. The input rows parameter is correctly set to New York City ownership parcels, and the selection type parameter is set to New Selection. In the expression builder click the where drop-down arrow and select Ownership Type. The logical operator is correctly set to is equal to. We want to set the ownership type is Residential conservation. Click OK and notice that 88 of the 1234 records are selected in the table and the corresponding features are selected in the map. In the table click show selected records to only show the 88 selected records and click show all records to show all records again. On the map tab in the selection group, you can clear the selection to deselect the records from the map and from the table. Go ahead and close the table.

Basemap
We can change the symbols that represent features in a layer and change the basemap that provides background context for the layers. Click the view tab for the New York City map to make the map active. On the map tab click basemap. A drop-down gallery of base maps appears. Click Firefly Imagery Hybrid to update the base map. In the contents pane there are two layers associated with the basemap: the world imagery Firefly layer at the bottom of the list of layers, and the hybrid reference layer which contains place name labels at the top.
Symbology
In the content pane, click the New York City ownership parcels layer to select it. On the feature layer tab click symbology to open the symbology pane. At the top of the pane there is a gallery tab and the properties tab. On the gallery tab you can choose a predefined symbol from the styles such as ArcGIS 2D that are added to the project. On the properties tab you can modify symbol properties such as colour and outline width. On the gallery tab search for park to see symbols that are typically used to denote parks. You can choose whichever park symbol you prefer.
Status bar
Status bar represents the statements of your data or map.
For more detailed steps follow the full written ArcGIS Pro Tutorial.
ArcGIS Pro Cost
ArcGIS Pro is not an open-source GIS Software. View ArcGIS Pro Pricing.
ArcGIS Pro Help
ArcPro help is provided through an online help system, and also offline help system. If you can’t access either system, a compact version of the help system can be used instead.
It is also provided on the user interface in the form of ScreenTips, messages, and pop-ups.
Open the Help Center
You are open the help center of different ways:
- In the upper right corner of the application window, click the View Help button

- On the start page, click Help

- Open the project, click the Project tab to open the Settings page. On the Settings page, click the Help tab on the left.
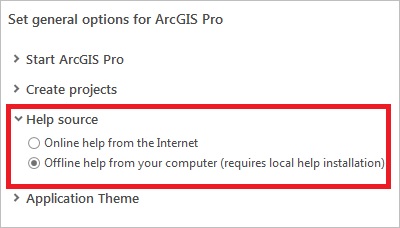
Help Source
By default, ArcGIS Pro uses the online help system. If you work offline, you can change the help source to the offline help system.
The offline help system access only for ArcGIS Pro desktop version.
1. Open the ArcGIS Pro Settings page in either of two ways:
- On the start page, click the Settings tab
 .
. - Open the project, click the Project tab on the ribbon.
 .
.2. In the settings list left side, click Options.
3. On the Options dialog box, under Application, click General.
4. Under Set general options for ArcGIS Pro, expand Help source and click an option:
- Online help from the Internet.
- Offline help from your computer (requires local help installation).
Comparison: ArcMap vs ArcGIS Pro
| Feature | ArcMap | ArcGIS Pro |
|---|---|---|
| Interface | Classic | Modern ribbon UI |
| 3D Support | Limited (ArcScene) | Full 3D integrated |
| Project Structure | One document | Multi-layout project |
| Performance | Slower | 64-bit optimized |
| Cloud Integration | Minimal | Full support |