Summary: – WebGIS include real-time data access, user-friendly interfaces, interactive maps, and cloud-based data storage. It supports a wide range of applications, and Data Formats. It is built using web technologies such as HTML, JavaScript, Web Mapping Services (WMS), and APIs, and often leverages platforms like Leaflet.
WebGIS: Mapping the World from Your Browser
Introduction: Mapping Magic in the Digital Age.
Have you ever wondered how Google Maps displays traffic in real time? or how disaster dashboards are updated with real-time information. The secret lies in WebGIS’ robust technology. It is the behind-the-scenes facilitation of our everyday location decisions. In this article, we will describe WebGIS in simple terms that beginners can understand yet, also provide in depth insights that professionals will appreciate.
What is WebGIS?
WebGIS is a short form of web-based geographic information system. It’s a Geographic Information System (GIS) which works through a web browser or application, from which people may access, view, analyze, and exchange spatial data on the web.
Now, a Question arises: why do we need WebGIS? Or, how WebGIS differs from traditional GIS?
| Aspect | Traditional GIS | WebGIS | Why WebGIS Matters |
|---|---|---|---|
| Access | Limited to specific systems | Accessible via any browser | Access anywhere, anytime. |
| Sharing | Manual, offline sharing | Real-time sharing using the Web. | Easy sharing |
| Ease of Use | Complex, requires expertise | User-friendly and interactive. | Simplifies GIS for everyone |
| Cost | High setup and maintenance | Lower cost, often open-source | Lower cost |
| Setup | Time-taking process | Quick setup on any device | Faster setup & flexibility |
Major Components of WebGIS

1. Frontend (Client Side): Browser
- Interface users interact with
- Technologies: HTML, CSS, JavaScript
- Libraries: Leaflet, OpenLayers, Mapbox GL JS
2. Backend (Server Side):
- Processes requests, conducts analysis and delivers data.
- Software: ArcGIS Server, MapServer, GeoServer.
- Languages: Python (Flask/Django), Node.js.
3. Database:
- Store’s location and attribute information.
- Tools: PostgreSQL with PostGIS, MongoDB, MySQL Spatial.
4. Web Map Services:
- WMS (Web Map Service) – for image maps
- WFS (Web Feature Service) – for vector data
- WMTS (Web Map Tile Service) – for quick tile loading
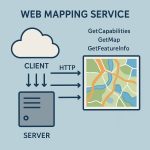
How Does WebGIS Work?
This simple flowchart shows how WebGIS operates — It forms a three-tier architecture.
- Presentation Tier: What users interact with
- Logic Tier: Where data processing happens.
- Data Tier: Where is it stored and fetched?
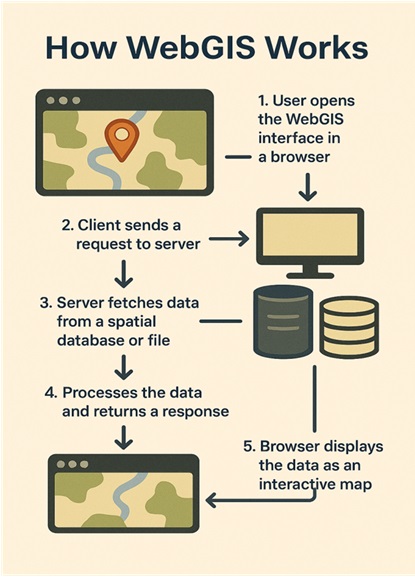
WebGIS operates under the client-server paradigm, employing web-based technologies such as HTML, JavaScript, CSS, and protocols such as HTTP/HTTPS and REST.
Requests (e.g., zoom or query) are sent by the client, the server interprets it, and returns map tiles or results. This builds in support for real-time, dynamic updates as well as rapid data exchange.
Top Tools & Platforms
| Tools | Type | Pros | Use-case |
|---|---|---|---|
| Leaflet.js | Frontend JS Library | Lightweight, simple | Beginner friendly |
| Geoserver | Backend Server | Open-source, WMS/WFS support | Data serving |
| ArcGIS Online | Commercial Platform | Drag-n-drop, secure | Quick dashboard |
Data Formats and Standard in WebGIS
1. Common Vector Formats:
Vector data stores geographic features in points, lines, and polygons. The following are widely adopted vector formats in WebGIS:
- GeoJSON: Basic and commonly used on web maps, particularly with JavaScript.
- KML: Developed by Google, suitable for Google Earth.
- Shapefile: Older but still ubiquitous format used in desktop GIS.
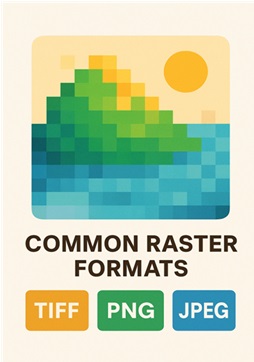
2. Common Raster Formats:
Raster data encodes information in a grid of cells, ideal for continuous data like satellite imagery or elevation models:
- GeoTIFF: Both image and location information are stored, very precise.
- PNG: Suitable for overlays with transparency
- JPEG: Compressed image; small size but lower quality.
- TMS Tiles: Pre-sliced image tiles to enable speedy loading in web maps.
3. OGC Standards:
The Open Geospatial Consortium (OGC) supplies interoperability standards to enable various systems and software to share and utilize geospatial data effectively:
- WMS (Web Map Service): Transmits map images.
- WFS (Web Feature Service): Transmits vector data in fact.
- WMTS (Web Map Tile Service): Transmits map tiles, which load quickly.
- CSW (Catalog Service for the Web): Allows users to query spatial data.
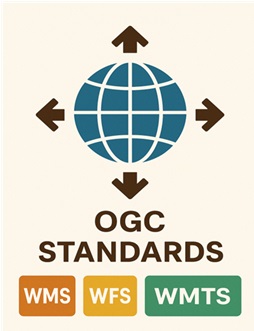
These standards are essential for interoperability, enabling various systems (e.g., QGIS, ArcGIS, GeoServer, Leaflet) to interact with each other seamlessly.
Map Projections and Coordinate Reference Systems in WebGIS
Map Projection–
It’s a method to unroll the curved Earth onto a 2D map. As this always bends something (such as size or shape), various projections are used for various purposes.
Coordinate Reference System (CRS)-
A CRS instructs the map where on Earth locations should be shown. It consists of:
- An Earth shape (datum)
- A method of projection
- Coordinate units (such as degrees or meters)
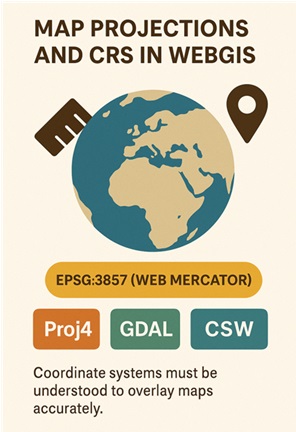
WebGIS and EPSG:3857–
The vast majority of online maps (such as Google Maps, OpenStreetMap) operate in EPSG:3857 (Web Mercator). It is quick to render but distorts size close to the poles.
Reprojecting–
When disparate datasets operate under different CRS, tools assist in converting them:
- Proj4: Conversion library between projections.
- GDAL: Utility for reading, writing, and converting GIS.
- EPSG codes: Codes such as 4326 or 3857 that recognize CRS.
Why Does It Matter?
If projections are not the same, map layers won’t be properly aligned. Having knowledge about CRS assists you with:
- Correctly overlaying maps
- Making accurate measurements
- Eliminating visual errors
WebGIS Application Types
1. Static Web Maps:
- These are non-interactive maps usually shared as images (e.g., PNG or JPEG).
- They show fixed content and are mainly used for display or printing.
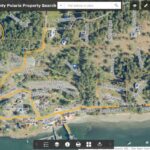
2. Interactive Web Maps:
- Users can pan, zoom, and click on features.
- Built with tools like Leaflet, OpenLayers, or Mapbox.
- Common in dashboards, data explorers, and city maps.
3. Analytical WebGIS:
- Provides tools for spatial analysis directly in the browser.
- Functions like buffering, routing, or area measurement are available.
- Useful for planning, urban development, and environmental studies.
4. Real-time WebGIS:
- Displays continuously updating data from live feeds.
- Examples include earthquake tracking, traffic updates, or weather maps.
- Relies on backend services and APIs to push real-time data.
Security in WebGIS
WebGIS handles public maps and personal user data, so top security is in order. Chief precautions are:
- HTTPS Encryption:
- Encrypts data transfer between servers and users to avoid interception.
- Authentication & Authorization:
- Authentication* ensures one knows who the user is (e.g., login).
- Authorization* regulates what they may view or do.PS Encryption:
- Encrypts data transfer between servers and users to avoid interception.
- API Keys & Tokens:
- Applied to secure access to services (such as basemaps or data APIs) and abuse.
- User Roles:
- Determine what various users are able to do:
- *Admin*: All control
- *Viewer*: Read-only
WebGIS vs Cloud GIS
- WebGIS refers to how GIS is delivered (via a web browser).
- Cloud GIS refers to where it is hosted (in the cloud).
All Cloud GIS is WebGIS, but not all WebGIS is Cloud GIS.
| Feature | WebGIS | Cloud GIS |
|---|---|---|
| Hosting | Can be a local server or cloud-based | Fully cloud-hosted (e.g., ArcGIS Online, GEE) |
| Access | Limited to server setup or local network | Accessible globally via the internet. |
| Scalability | Limited by local infrastructure | Highly scalable on-demand |
| Maintenance | Requires manual updates and backups | Automatic updates and backups |
| Examples | Leaflet maps, GeoServer apps | Google Earth Engine, ArcGIS Online |
| Flexibility | High customization, more control | Easier to deploy, but sometimes less customizable |
| Performance | Depends on the local server capacity | Optimized using cloud resources. |
Real-World Case Study: WebGIS in Action
While the theory of WebGIS is intriguing, its actual power might glow within real-world situations. Below are some impactful illustrations where WebGIS assists in answering real-world puzzles:
1. Disaster Management Dashboard:
In times of floods, earthquakes, or fires, governments and relief organizations use WebGIS dashboards to supply *real-time data* to the public and responders. The dashboards incorporate real-time data layers like rain gauge measurements, river levels, hazard areas, and evacuation routes.
One example is the “DisasterAWARE platform” by Pacific Disaster Center, which offers global, real-time hazard tracking and early warning:
DisasterAWARE Platform Live Dashboard.
These systems assist authorities in:
- Forecasting flood-prone locations
- Alerting individuals in advance
- Directing evacuation operations safely
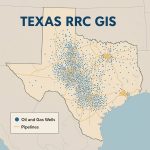
2. Forest Fire Monitoring with NASA FIRMS:
NASA’s *Fire Information for Resource Management System (FIRMS)* offers near real-time active fire data from satellites, available in an interactive WebGIS map.
You can inspect active fires globally here:
This assists in:
- Tracking wildfires
- Evaluating risks to adjacent towns
Modern Trends in WebGIS
WebGIS is transforming fast from simple 2D maps. New trends are redefining its potential:
Integration of AI and Machine Learning: Forecast traffic jams, city growth patterns, or disease outbreaks through spatial AI models.
3D WebGIS: Technologies such as [CesiumJS] allow for the creation of high-fidelity 3D city models and terrain visualizations within a web browser.
Mobile-First WebGIS: As most users view maps on tablets and smartphones, GIS applications are now built with responsive layouts and offline capabilities for mobile use. Today WebGIS is no longer limited to flat maps; it incorporates smart predictions, real-time 3D worlds, and accessibility on any device.
Challenges in WebGIS
In spite of its enormous benefits, WebGIS is confronted with a number of challenges:
Data Privacy: Maps made publicly available can reveal sensitive data such as home addresses, healthcare facilities, or critical infrastructure, necessitating rigorous access control and anonymization.
Internet Dependence: Most Web GIS applications rely on stable connectivity; in areas with poor internet, offline-enabled solutions or mobile caching are required.
Performance Bottlenecks: Dealing with extremely large datasets (e.g., high-resolution satellite imagery or intricate vector layers) can make web maps slow down, unless optimized tiling, spatial indexes, and data optimizations are used.
Understanding these challenges is central to designing secure, stable, and high-performance Web GIS solutions.
Create Your First Web Map Using Leaflet in 10 Minutes
Step:1 Create a New HTML File:
First, open your favorite code editor ( like VS Code, Sublime Text, or even Notepad).
Create a new file and save it as: map.html
Step:2 Add Leaflet Library to your HTML:
Write/ Copy and Paste the following into your map.html:
| <!DOCTYPE html> <html> <head> <title>My First Leaflet Map</title> <meta charset=”utf-8″ /> <meta name=”viewport” content=”width=device-width, initial-scale=1.0″> <!– Leaflet CSS –> <link rel=”stylesheet” href=”https://unpkg.com/leaflet/dist/leaflet.css” /> <!– Leaflet JavaScript –><script src=”https://unpkg.com/leaflet/dist/leaflet.js”></script> <style> #map { height: 90vh; width: 100%;} </style> </head> <body> <h2 style=”text-align:center;”>My First Interactive Map</h2> <!– Map Container –> <div id=”map”></div> <script> // JavaScript will go here </script> </body> </html> |
Step:3 Initialize the Map:
Inside the <script> tag (in the same file), add this code:
| <script> // Create the map and set its view var map = L.map(‘map’).setView([21.837780, 73.718890], 13); // Add OpenStreetMap tiles L.tileLayer(‘https://{s}.tile.openstreetmap.org/{z}/{x}/{y}.png’, { attribution: ‘Map data (c) OpenStreetMap contributors’, }).addTo(map); </script> |
This will center your map at The Statue of Unity (1.837780, 73.718890). At Zoom level 13.
Step 4: Add a Marker:
Still inside the <script> tag, after the map code, add a marker.
| <script> // Add a marker var marker = L.marker([21.837780, 73.718890]).addTo(map); // Add a popup to the marker. marker.bindPopup(“<b>Hello world!</b><br>I am at Statue of Unity.”).openPopup(); </script> |
Now, you will have a map with a clickable marker popup!
Step:5 Open Your Map in Browser:
Just double click your map.html file. It will open in your default browser. And your first interactive map is live!
Click here to see Map – My First Interactive Map (Don’t forget to click on the marker).