Summary: – Synthetic Aperture Radar (SAR) is an active remote sensing technology that uses microwave radar signals to create high-resolution images of the Earth’s surface, regardless of weather conditions or daylight.
Synthetic Aperture Radar (SAR): A Revolution in Microwave Remote Sensing
What is Synthetic Aperture Radar?
A Synthetic Aperture Radar (SAR) is an airborne or spaceborne side looking Radar system which utilizes the flight path of the platform to simulate an extremely large antenna or aperture electronically, and that generates high-resolution Remote Sensing imagery.
What is Synthetic in SAR?
The term “synthetic” in Synthetic Aperture Radar refers to the technique of simulating a very large antenna aperture by coherently combining the radar echoes received from multiple positions along the flight path of the Sensor. This synthetic aperture is not a physical structure but a computational construct that enhances the Resolution of the final radar image.
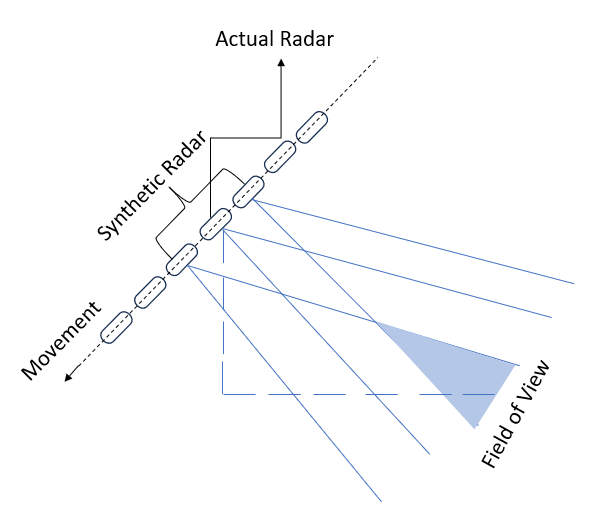
In traditional Real Aperture Radar (RAR) systems, the azimuth resolution (i.e., the resolution along the direction of flight) is determined by the ratio of the wavelength to the length of the physical antenna. For instance, in a C-band system with a wavelength of 5 centimeters, achieving a spatial resolution of 10 meters would require an actual antenna length of approximately 4.25 meters. However, such large antennas are impractical to mount on spaceborne platforms due to structural and engineering constraints.
In contrast, SAR systems are capable of achieving similar or even better resolution using much smaller antennas by leveraging the motion of the satellite or aircraft. As the platform moves forward, SAR collects backscatter data from multiple positions, and through advanced signal processing, it synthesizes a long antenna. The result is significantly enhanced spatial resolution—often in the order of meters or sub-meters—regardless of the actual antenna size.
Features:
- SAR is a Side-looking radar system which makes a high-resolution images of the Earth’s surface.
- Continuous strips of the ground surface are “illuminated” to one side of the flight direction.
- Signal is recorded and Digital signal processing techniques in the ground are used to focus the image and obtain a higher resolution image.
- The across-track distance is called the “Range”
- The along-track distance is called the “Azimuth”.
SAR Resolution
SAR resolution is typically divided into two components:
1. Range Resolution- is achieved by using Pulse compression technique.
Formula:
Rr=c/2B
where:
- Rr = range resolution
- c = speed of light (~3 × 10⁸ m/s)
- B = signal bandwidth
Higher bandwidth = better resolution.
2. Azimuth Resolution- is achieved by using Synthetic aperture concept.
Formula:
Ra=L/2
where:
- Ra = azimuth resolution
- L = physical antenna length
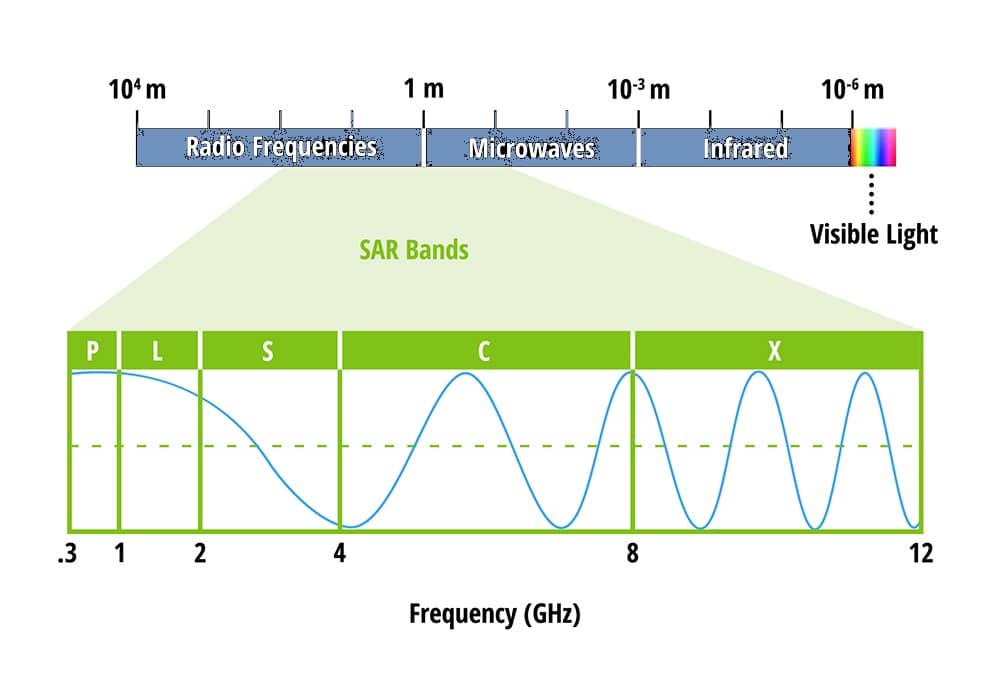
SAR Bands
Synthetic Aperture Radar Bands refer to the different microwave frequency ranges used by SAR sensors.
| Bands | Frequency (GHz) | Wavelength (cm) | Applications |
|---|---|---|---|
| X | 8–12 | 3.8–2.4 | High resolution SAR (urban monitoring, ice and snow, little penetration into vegetation cover; fast coherence decay in vegetated areas) |
| C | 4–8 | 7.5–3.8 | SAR Workhorse (global mapping; change detection; monitoring of areas with low to moderate penetration; higher coherence) |
| S | 2–4 | 15–7.5 | SAR Earth observation (agriculture monitoring, NISAR will carry an S-band channel; expends C-band applications to higher vegetation density) |
| L | 1–2 | 30–15 | Medium resolution SAR (geophysical monitoring; biomass and vegetation mapping; high penetration, InSAR) |
| P | 0.3–1 | 100–30 | Biomass. First p-band spaceborne SAR will be launched ~2020; vegetation mapping and assessment. Experimental SAR. |
Rarely used three bands in SAR:
| Bands | Frequency (GHz) | Wavelength (cm) |
|---|---|---|
| Ka | 27–40 | 1.1–0.8 |
| K | 18–27 | 1.7–1.1 |
| Ku | 12–18 | 2.4–1.7 |
How SAR Operates?
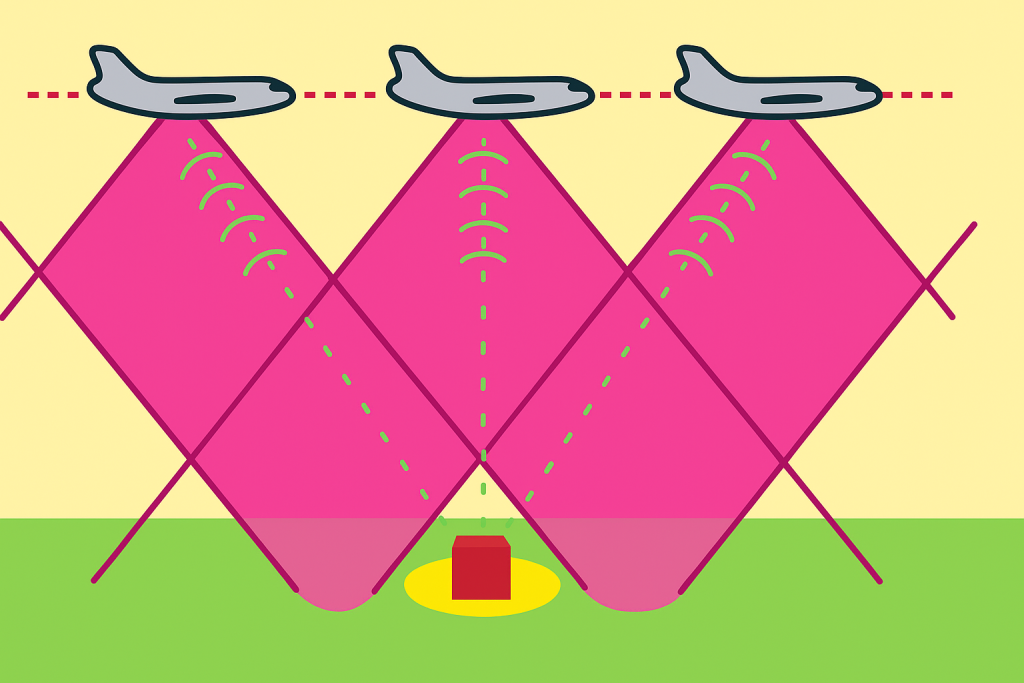
Synthetic Aperture Radar (SAR) systems are typically mounted on mobile platforms such as satellites, aircraft, or unmanned aerial vehicles (UAVs). As the platform moves forward, the radar antenna transmits successive pulses of microwave energy toward the Earth’s surface. Each transmitted pulse interacts with surface features and reflects to the sensor.
The SAR system records both the time delay and intensity of the returning signal. These successive reflections, collected from multiple positions along the sensor’s trajectory, are then processed and combined using sophisticated algorithms to create a high-resolution image. This processing effectively synthesizes a large aperture by treating each successive sensor position as a segment of a much longer antenna.
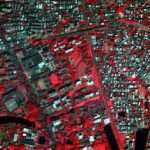
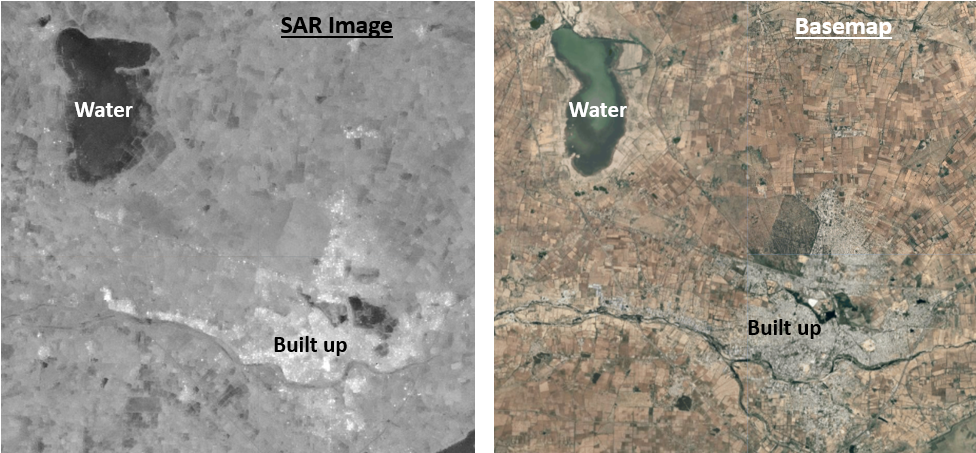
The final SAR image represents the variation in backscattered energy across the terrain, where brighter areas correspond to stronger reflections (e.g., rough surfaces, buildings, or metal structures) and darker areas correspond to weaker reflections (e.g., smooth water bodies or dry sand).
Factors Influencing SAR Backscatter
The strength and characteristics of the radar backscatter—or “radar return”—depend on a combination of system parameters and terrain properties. These interactions determine the brightness and texture observed in SAR imagery.
System Parameters
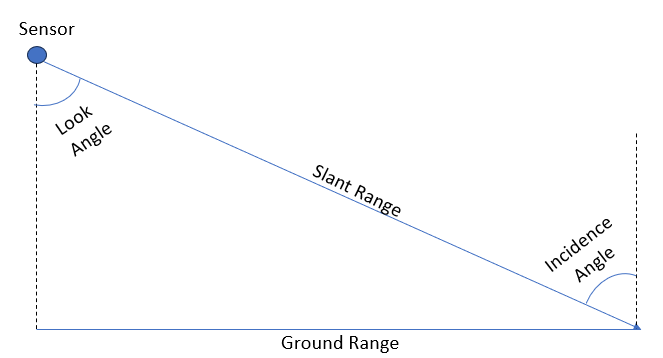
Incidence Angle
The incidence angle is defined as the angle between the radar beam and a line perpendicular to the surface at the point of contact. It directly affects the backscatter intensity. On flat terrain, the incidence angle and the radar’s look angle are nearly equal. As the incidence angle increases, the radar signal interacts differently with various surface features—generally resulting in lower backscatter from smooth surfaces and enhanced contrast for features like water bodies. It also influences geometric distortions such as foreshortening, layover, and shadowing, especially in areas with complex terrain.
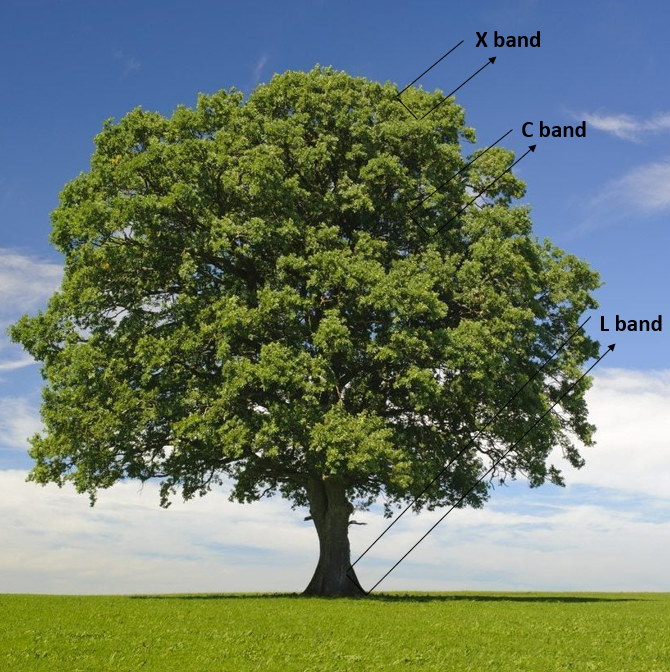
Wavelength/ Frequency
Different radar wavelengths interact with surfaces in varying ways. Shorter wavelengths (e.g., X and C bands) are sensitive to small surface features such as leaves, buildings, and roads. Longer wavelengths (e.g., L and P bands) can penetrate through vegetation canopies, snow, and even shallow soil layers, providing subsurface or structural information.
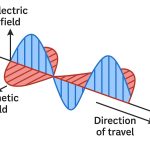
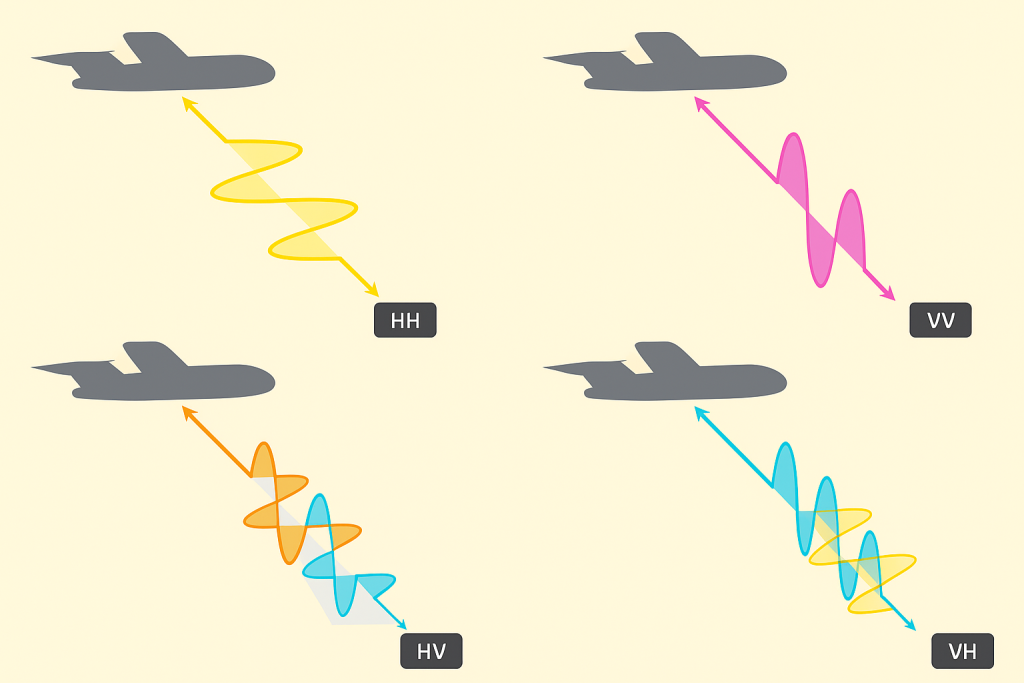
Polarisation
Polarization refers to the orientation of the electric field vector of the electromagnetic wave. In microwave remote sensing, the radar can transmit and receive signals in either horizontal (H) or vertical (V) polarization. Depending on the combination of transmission and reception, four types of polarization are commonly used:
- HH (Horizontal transmit, Horizontal receive)
- HV (Horizontal transmit, Vertical receive)
- VH (Vertical transmit, Horizontal receive)
- VV (Vertical transmit, Vertical receive)
Types of Polarization Sensors:
- Single-polarized sensors transmit and receive in only one polarization mode, such as HH or VV.
- Dual-polarized sensors can simultaneously transmit and receive in two combinations, typically including one like-polarized (HH or VV) and one cross-polarized (HV or VH) channel.
The polarization of the radar signal significantly affects the interaction with surface features. For example, surfaces such as calm water and flat terrain tend to reflect polarized signals specularly and may appear dark in both like and cross-polarized images. In contrast, vegetated areas often depolarize the signal due to their complex structure, resulting in higher backscatter in cross-polarized images.
By comparing images from different polarization modes, analysts can derive valuable information about land cover, vegetation density, urban structures, and surface roughness. PolSAR technology is especially useful in applications involving agricultural monitoring, wetland classification, and forest biomass estimation.
Terrain Surface Properties
Surface Roughness
The roughness of the surface relative to the radar wavelength plays a critical role in determining the radar return.
The Rayleigh criterion considers a surface to be smooth if
h <
where h = height of surface irregularities
λ = radar wavelength
ϒ = grazing angle (angle between the terrain slope and the incident radar wave).
and, defines the rough surface if
h >
Peake and Oliver’s modified Rayleigh criterion defines the smooth and rough surfaces in the following way.
If h < they are termed smooth
If h > they are termed as rough
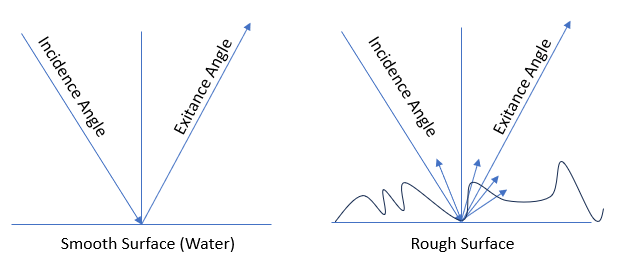
Smooth surfaces reflect the incident energy away from the sensor, resulting in low backscatter (dark areas in SAR images), while rough surfaces scatter energy in multiple directions, including back toward the sensor, leading to high backscatter (bright areas).
Dielectric Constant
The dielectric constant of a material indicates how easily it can become polarized in response to an electric field. Materials with a high dielectric constant (such as water) can reflect more microwave energy, resulting in a stronger radar return. Conversely, materials like dry soil or sand, with lower dielectric constants, produce weaker backscatter. The dielectric constant also varies with moisture content, making SAR especially useful in soil moisture and hydrological studies.
| Material | Dielectric Constant |
|---|---|
| Air | 1.00059 |
| Asphalt | 2.7 |
| Ice | 4.2 |
| Pebble | 5.4-6.6 |
| Sand | 3-5 |
| Snow | 3.3 |
| Vacuum | 1 |
| Water | 80 |
Feature Orientation
The orientation of linear surface features with respect to the radar look direction can significantly influence backscatter. Features that are perpendicular to the radar’s look direction will typically produce stronger returns and are more easily identified in SAR images. In contrast, features aligned parallel to the look direction may yield weaker returns, reduce image contrast, and make feature recognition more challenging.
Backscattering Coefficient and Interpretation
The radar backscattering coefficient (σ⁰) is a quantitative measure of the reflectivity of the surface and is expressed in decibels (dB). It is calculated as:
σ (dB) = 10.Log10 (energy ratio)
or
σ (dB) = 10.Log10 ( )
The backscatter coefficient allows analysts to infer surface characteristics:
- > -5 dB: Very rough surfaces or man-made structures (e.g., buildings, metal roofs)
- 0 to -10 dB: Dense vegetation such as forests
- -10 to -20 dB: Moderately rough surfaces such as agricultural fields or shrublands
- < -20 dB: Very smooth surfaces like calm water or dry sand
SAR Data Formats and Processing Levels
Depending on the application and processing level, SAR data can be stored and interpreted in different formats:
- Single Look Complex (SLC): This format retains both amplitude and phase information for each radar echo. It is essential for applications such as interferometric SAR (InSAR), which is used to measure ground deformation and subsidence.
- Ground Range Detected (GRD): GRD products contain only the amplitude (intensity) of the signal and are projected onto a ground coordinate system. These images are suitable for visual interpretation, land cover classification, and general mapping.
- Polarimetric SAR (PolSAR): This format captures data in multiple polarization channels (e.g., HH, HV, VV), allowing a more nuanced analysis of surface properties and structures.
Advantages of SAR in Earth Observation
Synthetic Aperture Radar offers several significant advantages over optical remote sensing:
- It can operate both during the day and at night, as it is not dependent on solar illumination.
- It is capable of penetrating cloud cover, fog, smoke, and rain, allowing for consistent observations regardless of weather conditions.
- Longer wavelengths can penetrate vegetation canopies, snow cover, and shallow soil, enabling subsurface observation.
- SAR provides high spatial resolution images that are independent of the platform’s altitude.
- It allows precise distance measurement based on signal timing and phase.
- The technology is sensitive to surface characteristics such as texture, roughness, moisture content, and dielectric properties.
Applications of SAR Remote Sensing
Synthetic Aperture Radar is employed across a wide range of fields due to its unique capabilities:
- Disaster Management
- Rapid flood mapping
- Earthquake deformation monitoring (via InSAR)
- Landslide detection
- Agriculture and Soil Monitoring
- Soil moisture estimation
- Crop condition assessment and classification
- Forestry
- Forest biomass estimation
- Monitoring deforestation and forest degradation
- Urban and Infrastructure Monitoring
- Detection of land subsidence
- Stability analysis of buildings and infrastructure
- Environmental and Climate Studies
- Glacier and ice sheet monitoring
- Wetland delineation and mapping
- Oil spill detection in marine environments
Conclusion
Microwave remote sensing, and specifically Synthetic Aperture Radar (SAR), has transformed our ability to monitor and analyze the Earth’s surface with precision and reliability. Unlike traditional optical systems, SAR offers the distinct advantage of being unaffected by weather conditions or the absence of sunlight. Its capability to penetrate clouds, vegetation, and even shallow layers of soil or snow makes it a powerful tool for observing both surface and subsurface features.
By leveraging different system parameters such as frequency, polarization, and incidence angle, SAR systems can be finely tuned for specific applications—from tracking natural disasters and monitoring environmental changes to assessing agricultural health and urban infrastructure stability. The availability of various data products and formats, including polarimetric and interferometric SAR, further enhances its analytical depth.
As Earth observation demands become increasingly complex and frequent due to climate change, urbanization, and natural hazards, SAR’s all-weather, day-and-night imaging capability positions it as an essential technology for sustainable development, disaster preparedness, and scientific discovery.