Raster Data: The Pixelated Universe
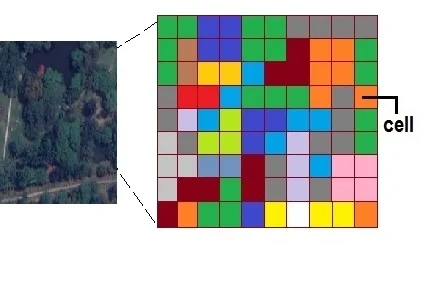
Raster data is a matrix of cells (pixels). Each pixel holds a value, representing:
Color (in images)
Temperature (in weather maps)
Elevation (in terrain maps)
NDVI or other spectral indices (in satellite imagery)
Imagine raster like a photo – zoom in enough, and you’ll see little colored squares.
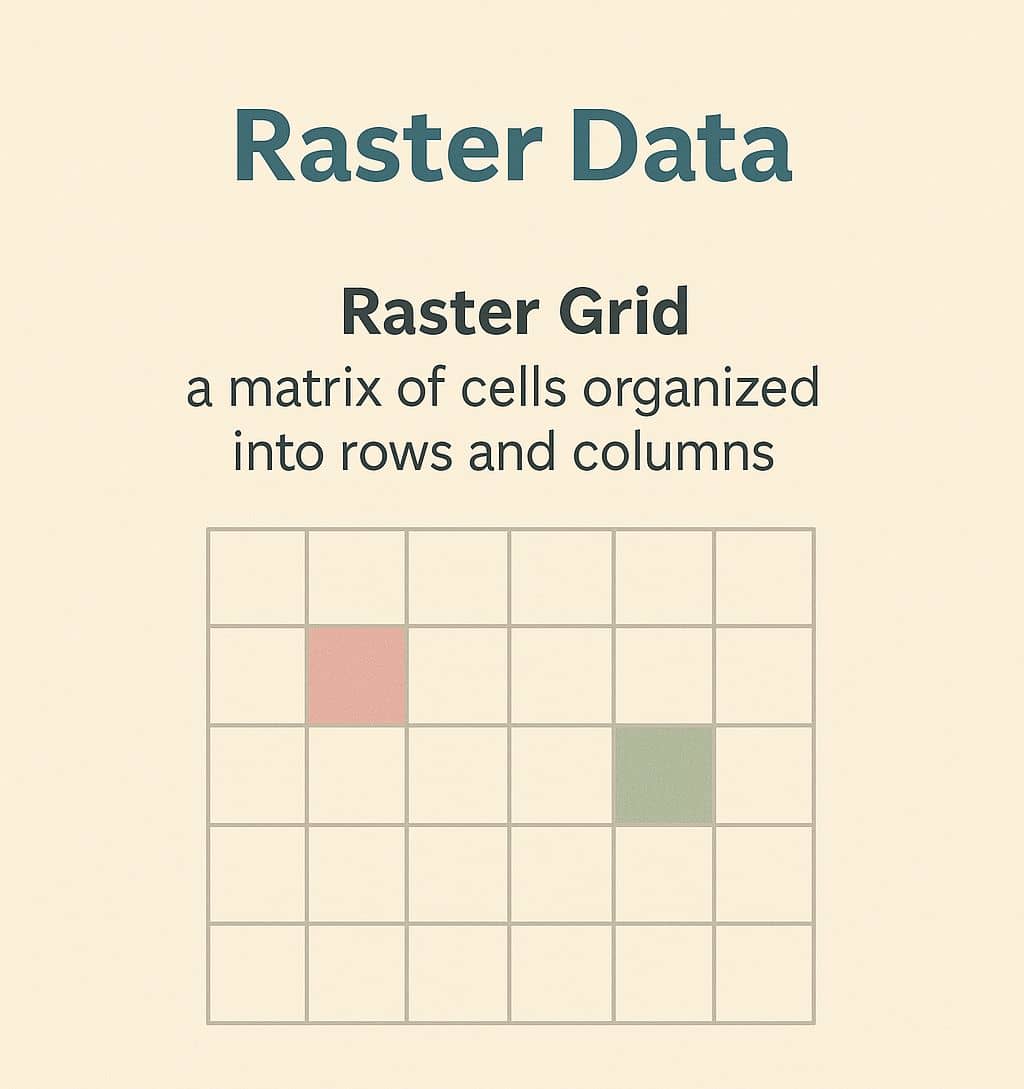
What is Raster Data?
Raster data represent real world data, within the GIS environment. It consists of a matrix of cells (pixels) organized into rows and columns (grid) where each cell contains a value representing information. Raster database represents continuous data such as Elevation, Slope, Surface.
Raster Database are Digital Aerial Photographs, Satellites imagery, Digital pictures, or even scanned Maps.
- Grid and cells
- For continuous data such as elevation, slope, surfaces
Detailed Explanation of Raster Data
Raster data is utilized in GIS to map continuous data across an area that cannot easily be split into vector features. Vector data comprises point, polyline, and polygon features that are ideally suited to things such as trees, roads, and building footprints. Nevertheless, some landscape features such as grassland with color and type variations are more difficult to map with vectors. Although it is the case that it is possible to enclose a polygon around each patch of grassland, this will generalize and lose important information. The assignment of attribute values to vector features is to the whole feature and thus less ideally suited to non-uniform attributes.
Raster data is represented by both the real-world images, say satellite and aerial photographs, and abstract ideas. For instance, it can represent patterns of rain or fire hazard. In such a case, every raster cell holds a value, that is, fire hazard on a scale of one to ten.
Raster Analysis Examples:
- NDVI (Vegetation Index): (NIR – Red) / (NIR + Red)
- Slope & Aspect: From DEMs
- Suitability Analysis: Combine soil type (raster), roads (vector), and rainfall (raster)
Georeferencing
Georeferencing specifies the precise location of a picture on the Earth’s surface. This is captured along with the digital aerial photograph. When opened by a GIS program, it places the photograph in its proper location on the map. It will typically contain the top left pixel coordinate, X and Y pixel resolution, and any rotation. The GIS software utilizes this information to project raster data in the proper location. The georeferencing information is typically in a small text file associated with the raster.
Raster data is acquired mainly by aerial photography and satellite imagery. An airplane flies over an area with a camera georeferencing images on a computer to take aerial photography. Satellites capture satellite imagery using digital cameras that send images to earth through radio signals to receiving stations. That is referred to as remote sensing.
Raster Analysis Examples:
- NDVI (Vegetation Index): (NIR – Red) / (NIR + Red)
- Slope & Aspect: From DEMs
- Suitability Analysis: Combine soil type (raster), roads (vector), and rainfall (raster)
Advantages of Raster Model
Since each raster cell stores one value or attribute, mathematical operations and modeling using raster data are much more efficient and easier. Also, unlike vector models, with continuous data that is represented and visualized poorly, the grid structure that is inherent in a raster model is well-suited for such endeavors.
Decoding Resolutions: The Triple Lens of Raster Data
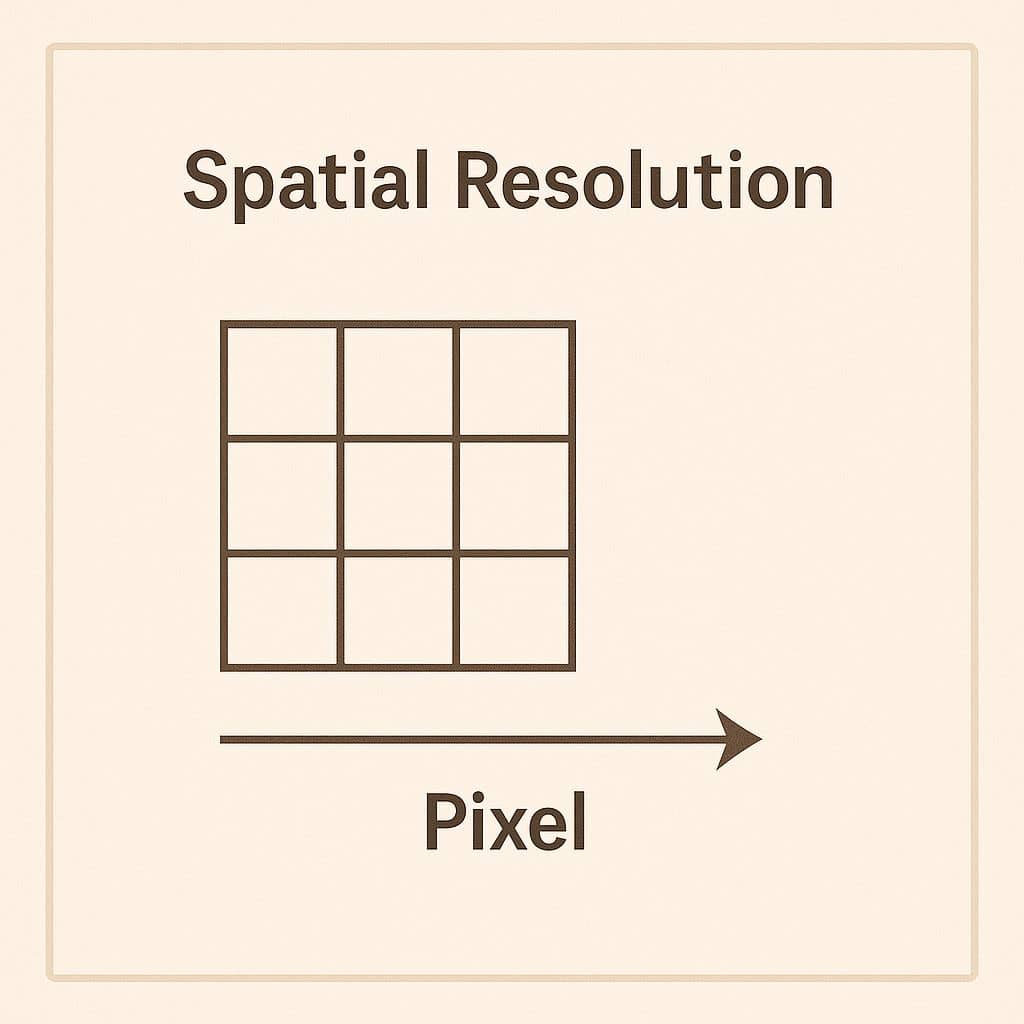
Spatial resolution
This is the size of every pixel (e.g., 10m, 30m). Fine spatial resolution gives you finer details, i.e., you can see small things like buildings, trees, or thin roads. It is very helpful for maps of cities, precision agriculture, or tracking infrastructure. Low spatial resolution looks at larger areas and is okay for studying areas or the whole world but might not have small details.
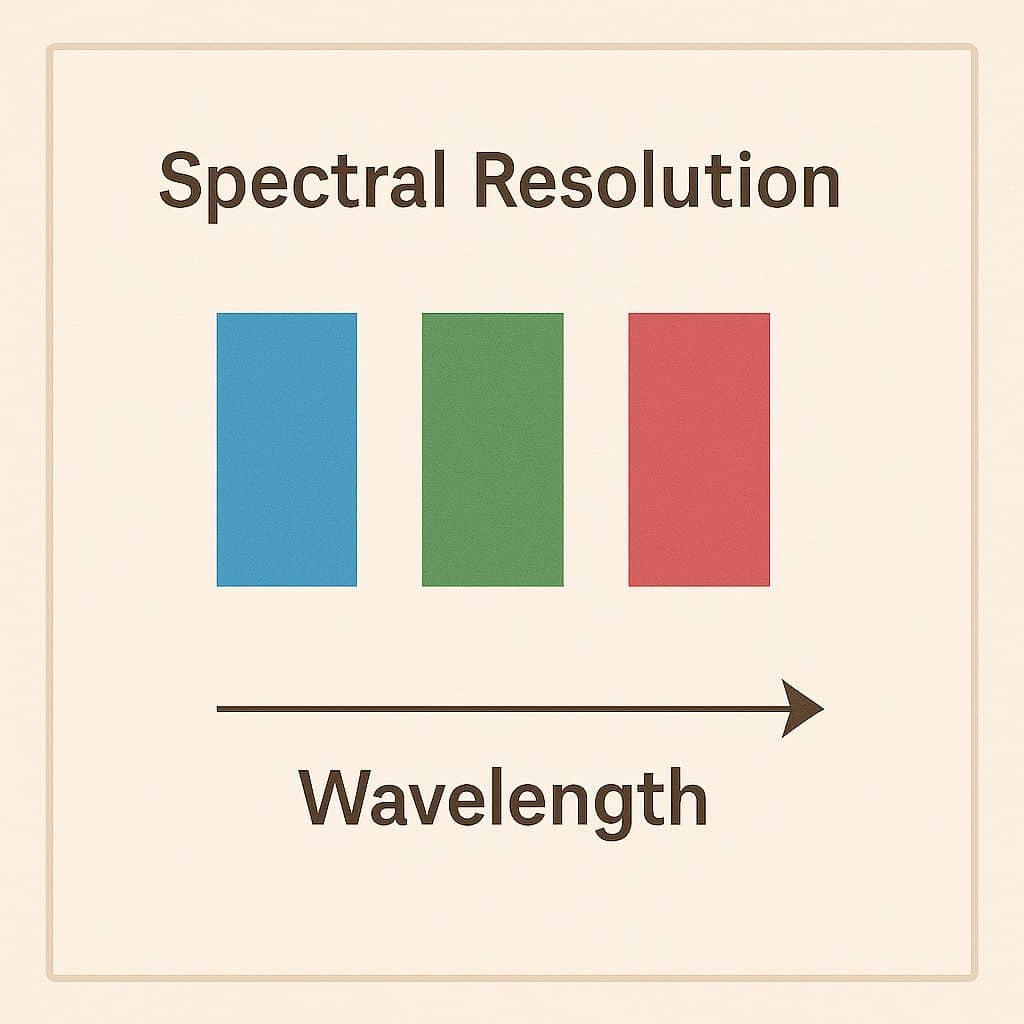
Spectral resolution
This is the number of and the width of the spectral bands that a sensor detects. Higher spectral resolution is the ability of the sensor to detect smaller differences in wavelength. This is beneficial in distinguishing different land covers, tracking plant health, finding minerals, and analyzing constituents in water. Hyperspectral sensors with many narrow bands provide positive material identification
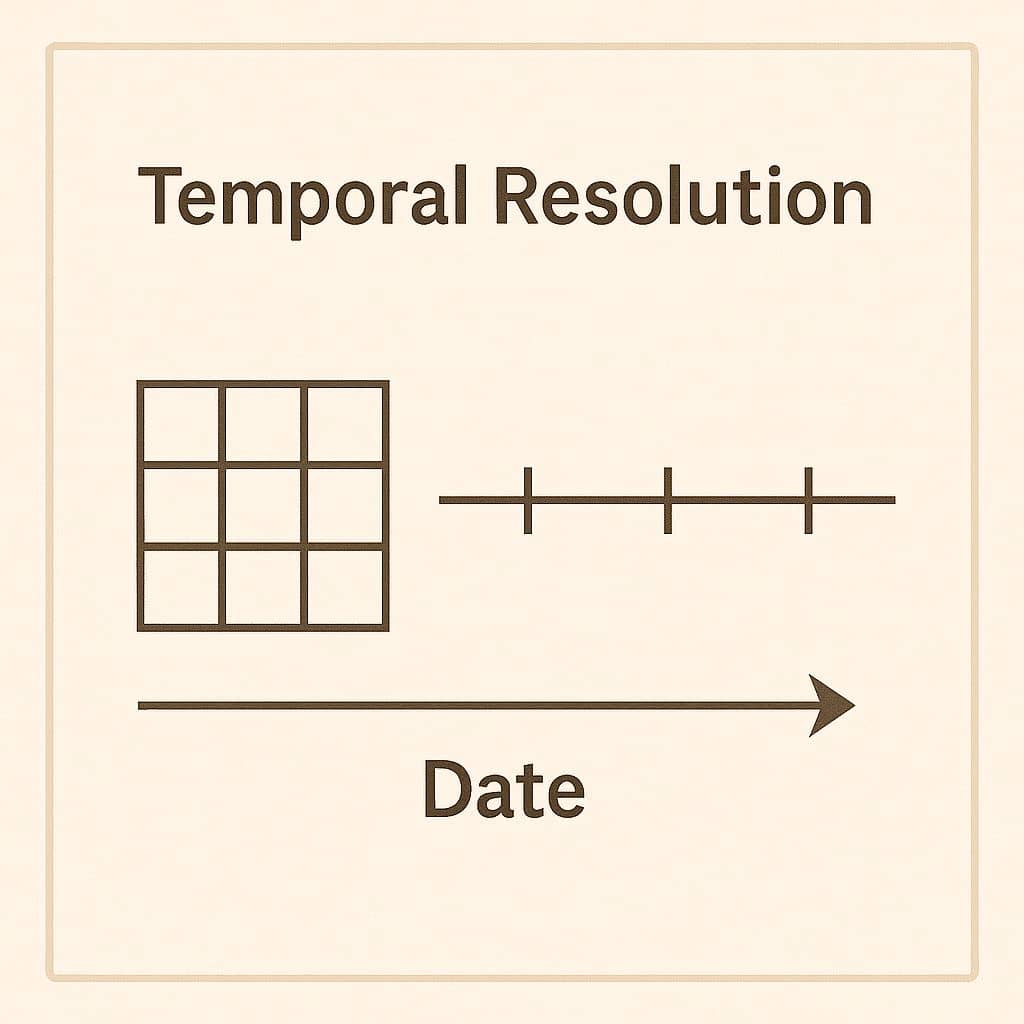
Temporal resolution
Specifies the frequency at which data are recorded for the same location. Fast change such as vegetation growth, floods, fires, or agriculture needs high temporal resolution (e.g., daily or a few days). MODIS, for example, produces near-daily images, Landsat returns every 16 days, and Sentinel-2 every 5 days (with each satellite operational).
Types of Raster Data
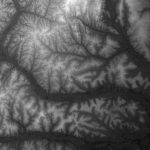
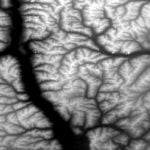
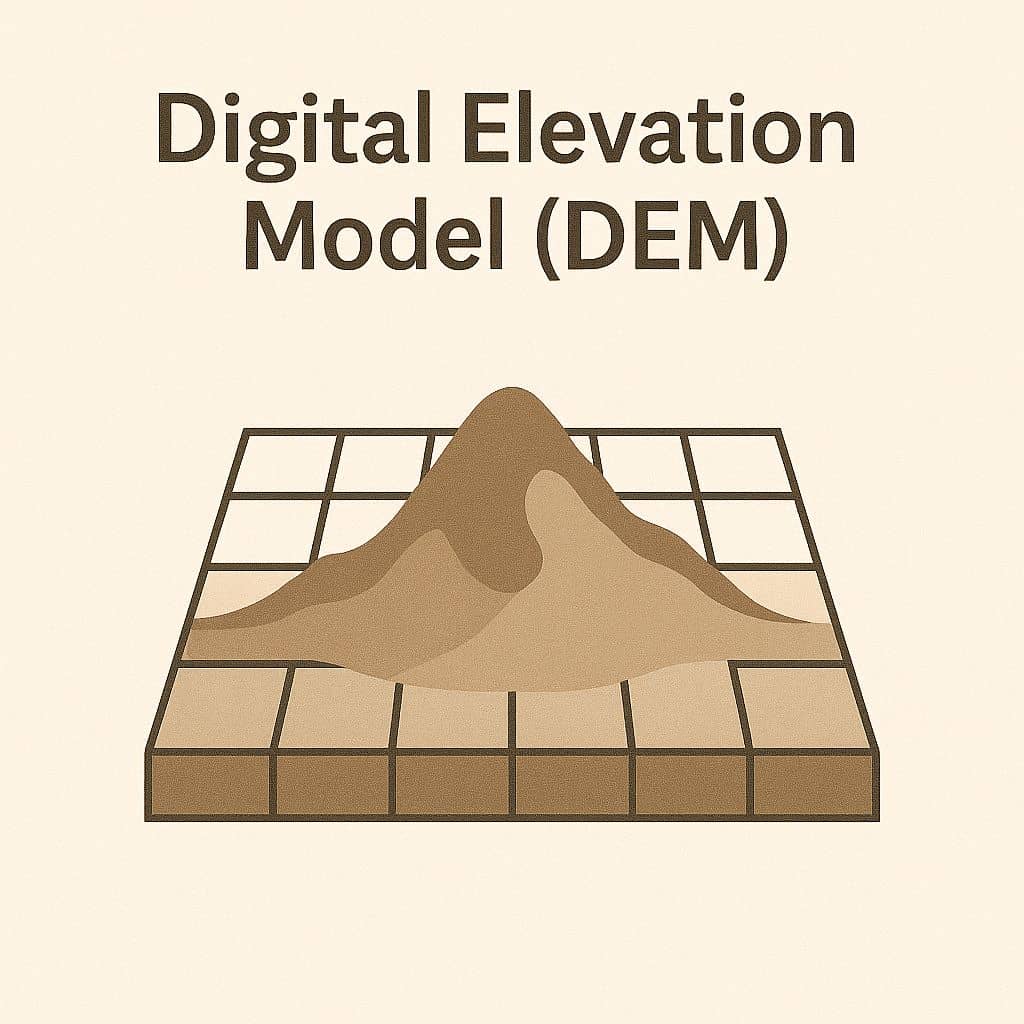
Elevation models (DEM, DTM): are height maps over the ground. Digital Elevation Models (DEM) and Digital Terrain Models (DTM) are those which are utilized to study landforms, predict floods, and study views
Orthophotos (Orthomosaics): are clear, georeferenced images made by combining aerial pictures. These images are fixed to remove problems caused by the land’s shape and the camera angle. They are used for precise mapping, planning land use, and checking the environment.

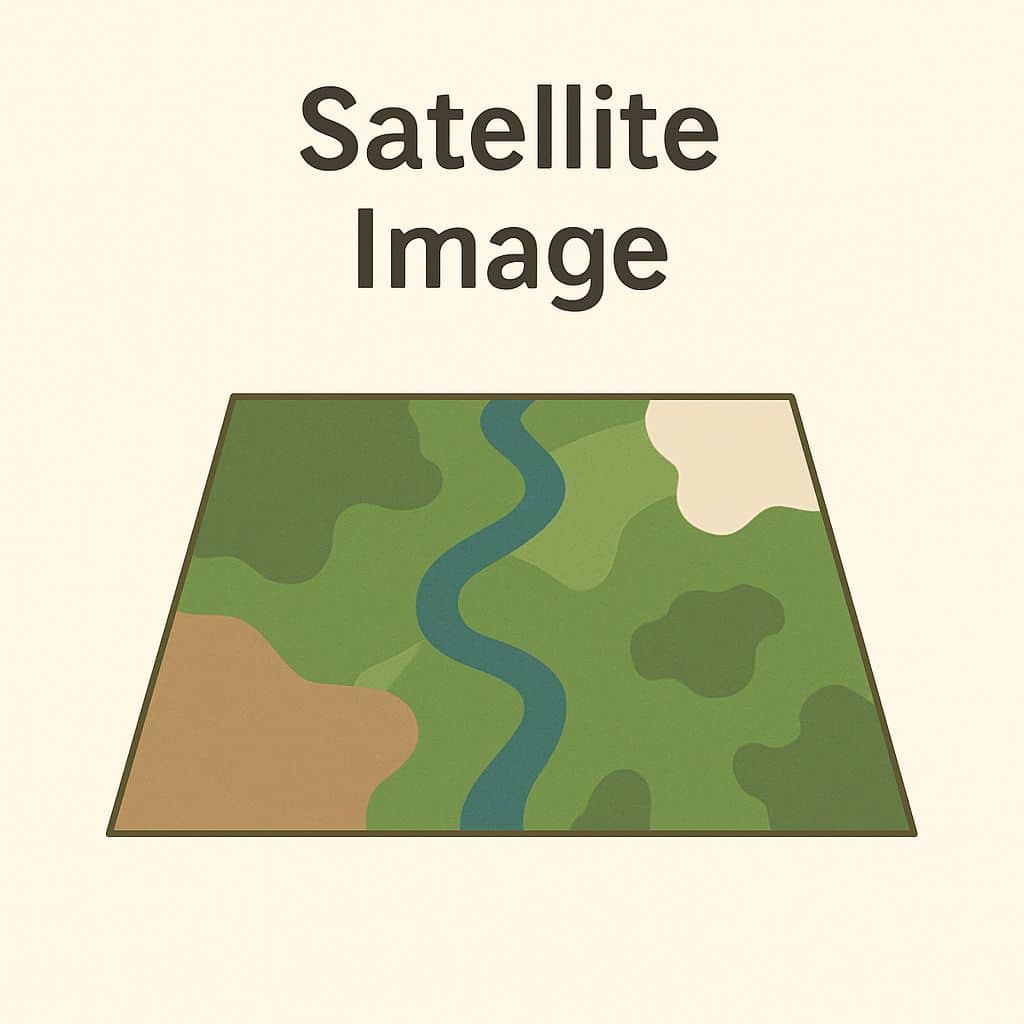
Satellite images: Photographs captured by satellites that reveal what the Earth’s surface appears like. They are employed to monitor changes in land cover, evaluate agriculture, and design cities.
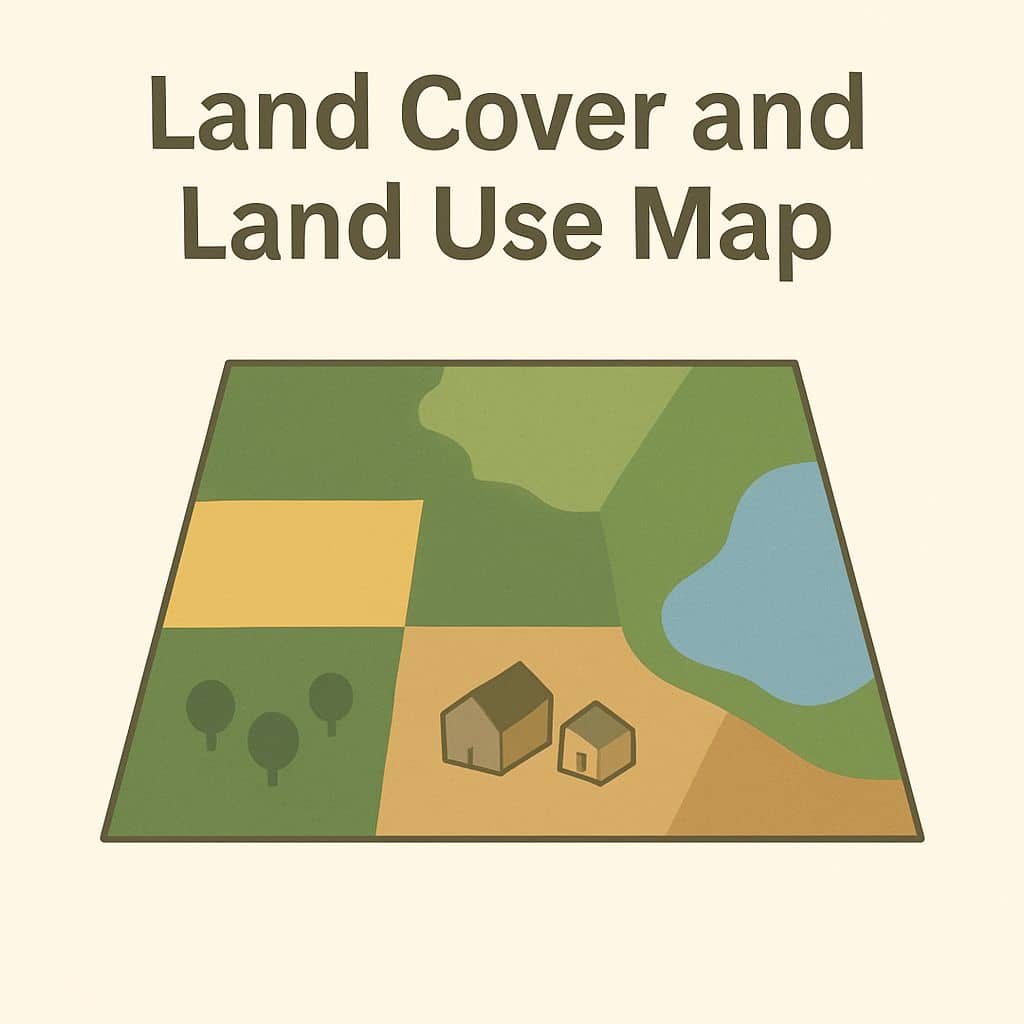
Land cover and land use maps: Raster data classifying land cover classes (e.g., forest, urban, water) or land use classes (e.g., residential, commercial, agricultural).
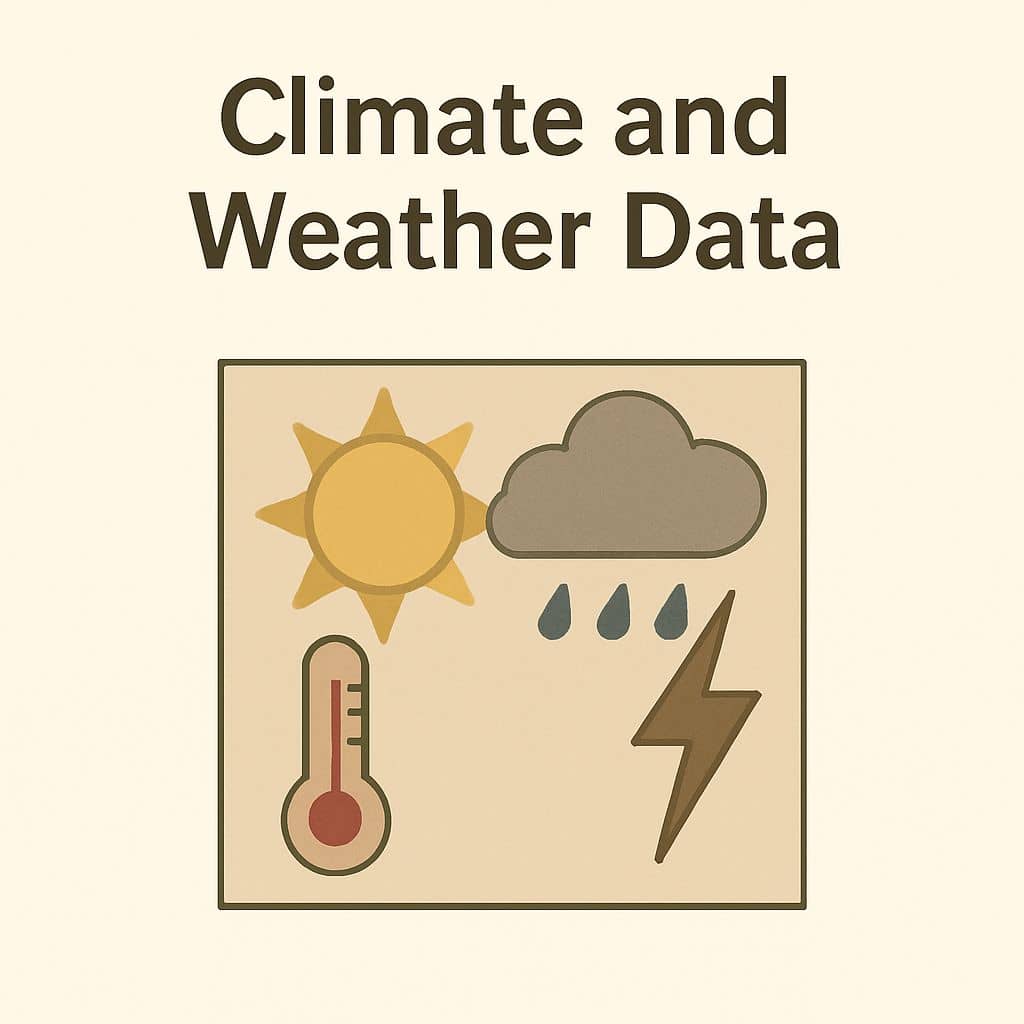
Climate and weather data: Raster data sets containing weather data such as temperature, precipitation, and humidity, for environmental and climate studies.
Raster File Formats
- .tif / .Geotiff – stores spatial info – A widely used format for georeferenced raster images, supporting both spatial data and metadata.
- .Img – used in ERDAS
- .jpg, .png – image overlays
- PNG (.png) – supports transparency and lossless compression, suitable for web-based mapping and GIS applications.
- JPEG (.jpg) – Commonly used for compressed photographic images, though not typically used for GIS analysis due to lossy compression.
| File Formats | Full Form |
|---|---|
| BMP | Bit Map Image |
| ECW | Enhanced Compression Wavelet |
| JPEG (JPG) | Joint Photographic Experts Group |
| PCX | Personal Computer Exchange |
| PNG | Portable Network Graphics |
| TIFF | Tagged Image File Format |
| GIF | Graphics Interchange Format |
| PICT | Image Originator Apple Computer |
| RLC | Run Length Compressed |
| IGS | Image in Grayscale |
| GEOSPOT | Spot Image Corp.(Georeferenced Image) |
| GEOTIFF | Georeferenced Tiff Image |
| MRSID | Multiresolution Seamless Image Database |
| Exif | Exchangeable Image File Format |
| PSD | Adobe PhotoShop Document |
| ADRG | Arc Digitized Raster Graphics |
| SDTS | Spatial Data Transfer Standard |
| IMG | Erdas Imagine Image |
| CALS | Computer-aided Acquisition Logistics and support |
| TGA (TARGA) | A Simple run length encoded image format |
From Pixels to Shapes: Converting Raster to Vector
In GIS, there are times when we need to turn fuzzy, pixel-based data into clean, defined shapes—and that’s exactly what raster to vector conversion helps us do.
Raster data (like satellite images or heatmaps) is great for showing continuous surfaces, but it’s not always ideal when you need precise boundaries, like drawing property lines or calculating the area of a forest. That’s where vector data—made up of points, lines, and polygons—comes in handy.

So, how does this conversion work?
The process is called vectorization. It involves scanning through a raster layer and grouping together pixels that share the same value (or are similar). These groups of pixels are then outlined and transformed into vector shapes.
For example:
If a raster image shows forest areas in green, the software can detect all the connected green pixels and draw a polygon around them. That polygon now represents a clear forest boundary—easy to measure, map, or analyze.
This kind of conversion is useful when:
- You want to digitize natural features like lakes or land cover.
- You need cleaner, editable shapes for maps.
- You’re combining raster data with other vector layers in a project.
Keep in mind: this process can take time, and some clean-up might be needed after converting, especially if the raster is noisy or low-resolution.
Raster vs Vector – A Quick Summary
| Feature | Vector | Raster |
|---|---|---|
| Accuracy | Very high for defined shapes | Depends on resolution |
| Data Size | Lower | Higher |
| Storage | Points, lines, polygons | Rows × Columns of cells |
| Use Case | Street maps, utilities | Remote sensing, terrain models |
| Tools | QGIS, ArcGIS, PostGIS | ENVI, SNAP, Google Earth Engine |
In details: Difference Between Raster Data vs Vector Data.
Raster Data in Environmental Monitoring and Management
Raster data is very effective in environmental management and monitoring, particularly for large, continuous phenomena.
Studies of deforestation in tropical rainforests are an important field of study. Scientists make use of satellite images, which are raster data, to track temporal change in forest cover. Every single pixel in the imagery can be associated with a 30×30 meter square plot of ground, with different features such as vegetation density, land surface temperature, or moisture content.
This raster data assists researchers in estimating deforestation levels, identifying regions of high conservation value, and predicting the probable impacts of forest cover loss on climate and biodiversity. Also important are raster-based digital elevation models (DEMs) in hydrology. They predict flood regions, optimize water management networks, and compute erosion hazard in dynamic environments.