Esri/ ArcGIS for Power BI Tutorial
Picture this: you’re sifting through rows of sales figures, spreadsheets brimming with customer addresses, performance indicators, and growth statistics. Yet, something feels amiss. The story behind the numbers remains elusive.
Now, imagine that same data visualized on an interactive map cluster highlighting where your business excels, patterns emerging in real-time, and fresh opportunities appearing with every zoom. This is the power of ArcGIS for Power BI.
What is ArcGIS Power BI?
ArcGIS Power BI (Business Intelligence) is a custom data visualization built into Microsoft Power BI that brings mapping capabilities to reports and dashboards.
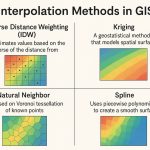
It offers mapping capabilities, demographic data, location analytics, and spatial analysis tools. The tool enables you to map and visualize your data. The built-in spatial analysis tools and Esri’s rich collection of global data can help you uncover patterns and trends that are difficult to see in charts, tables, or spreadsheets.
You can create and view ArcGIS map visualizations in the Power BI service or Power BI Desktop. Also Make better business decisions with Esri Power BI, available now at no cost.
A Crucial Element in Your BI Strategy
Power BI excels at creating charts, graphs, and dashboards. However, when it comes to geographical data, it only offers a glimpse. This is where ArcGIS steps in adding a deeper layer of understanding through spatial analytics.

With ArcGIS for Power BI, you’re not just placing markers on a map. You’re revealing the reasons behind events in specific areas. It embodies business intelligence with a geographical perspective.
Usage:
Power BI allows you to visualize data on maps, including the following uses:
- Make area-based selections.
- Geo-enable your data more accurately.
- Display your data using smart map themes.
- Understand the demographics of areas you are interested in.
Benefits:
- Visualize data on maps for unique insights, built smart mapping capability, helps you choose the right style and display for your data.
- Spatially analyze your data, create heat maps, aggregate data into clusters, determine drive time, or find the nearest location.
- Bring geographic data created in your organization into Power BI and integrate it.
What Sets ArcGIS for Power BI Apart?
1. Smart Mapping with Visual Appeal Forget simple pin drops
ArcGIS allows you to:
- Automatically apply location-based color schemes.
- Use heat maps, bubble clusters, and 3D shading.
- Switch between modern basemaps to match your brand or message.
2. Integrated Spatial Insights with ArcGIS for Power BI
Need to determine the optimal location for your next store or identify supply chain challenges? ArcGIS for Power BI enhances your decision-making capabilities with sophisticated spatial tools:
- Drive-time and walking zones – Quickly visualize customer catchment areas.
- Clustering tools – Uncover concealed geographic patterns and concentrations of customers.
- Buffer rings – Assess impact zones surrounding stores, warehouses, or other essential assets.
- Sales performance mapping – Superimpose revenue data on maps to reveal regional trends and opportunities.
- Logistics optimization – Illustrate supply routes and identify inefficiencies within distribution networks.
- Market penetration analysis – Locate underserved areas and accurately target new customer segments.
- Risk and impact analysis – Evaluate exposure to environmental or regulatory risks through spatial overlays.
3. Data Meets Context
ArcGIS integrates global demographic information—such as income, age, education, and lifestyle—that you can layer with your own data. This adds tangible depth to your customer segmentation.
Getting started with Power BI: step-by-step
Use Power BI directly from Power BI or sign in using your ArcGIS account to access content from your organization.
Use the following steps to create maps in ArcGIS for Power BI:
Step-1: Prepare your data
When you add data to a map from Power BI, choose the location type that best represents your information. Location information from your data is used to create a relationship between your business data and the specified location type.
Power BI uses the ArcGIS World Geocoding Service to detect point locations (such as- addresses, United States cities, and world cities) and the ArcGIS Geo-enrichment Service to detect boundary locations (such as- ZIP Codes, states, provinces, and countries).
Step-2: Add a map to a report
1. Sign in to Power BI and connect to your data source.
2. Open a report or create a new one.
3. When Visualizations pane appears, click the ArcGIS for Power BI visualization.
A new Power BI visualization appears on the report page. Now you’re ready to add data to the map.
Step-3: Add data to the map
To add location data, do the following:
1. In the Fields pane, expand the dataset with which you want to work.
2. In the Visualizations pane, if the Fields tab is not already selected, click the tab to show the map’s field wells.
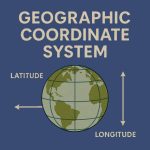
3. Drag field values in the Location or Latitude and Longitude field wells in the Visualizations pane.
Step-4: Edit the map contents
1. Open a map-enabled report or create one.
2. Click the ArcGIS for Power BI visualization to enable Author mode.
3. On the map, click the Map tools button to expand the list of tools.
4. On the Power BI ribbon, click File and click Save to save your changes to the report.
Step-5: Share a map-enabled report
1. Share the PBIX file for your colleagues to open in Power BI Desktop.
2. Publish the report to Power BI service (online).
Other methods of sharing in Power BI, such as publishing the report to the web and embedding the report.
Create Report in ArcGIS for Power BI
1. First, you need to create an account in Power BI.

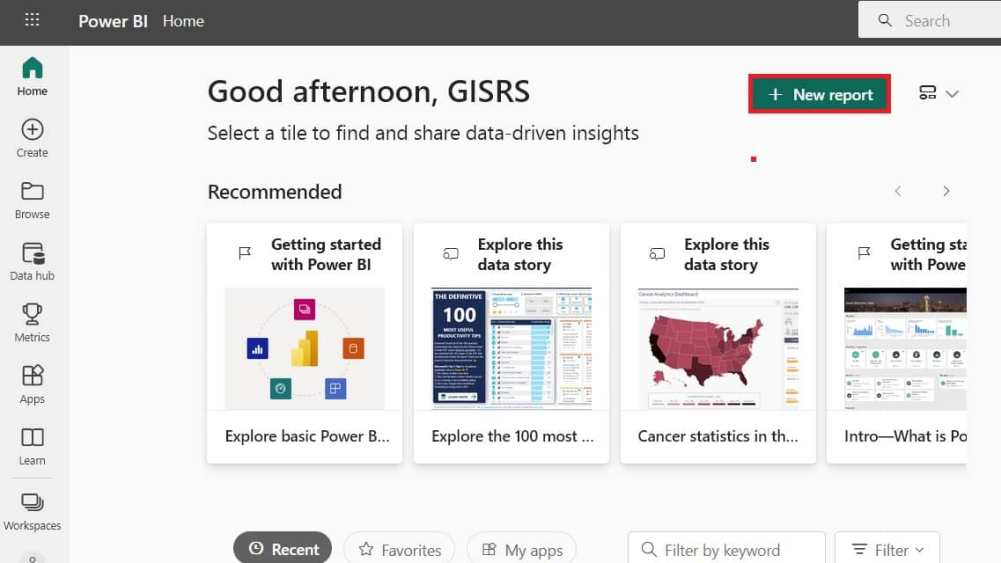
2. Once you have completed the account set-up process, create a new Report.
3. Click New Report button.
4. Add data to build a report.
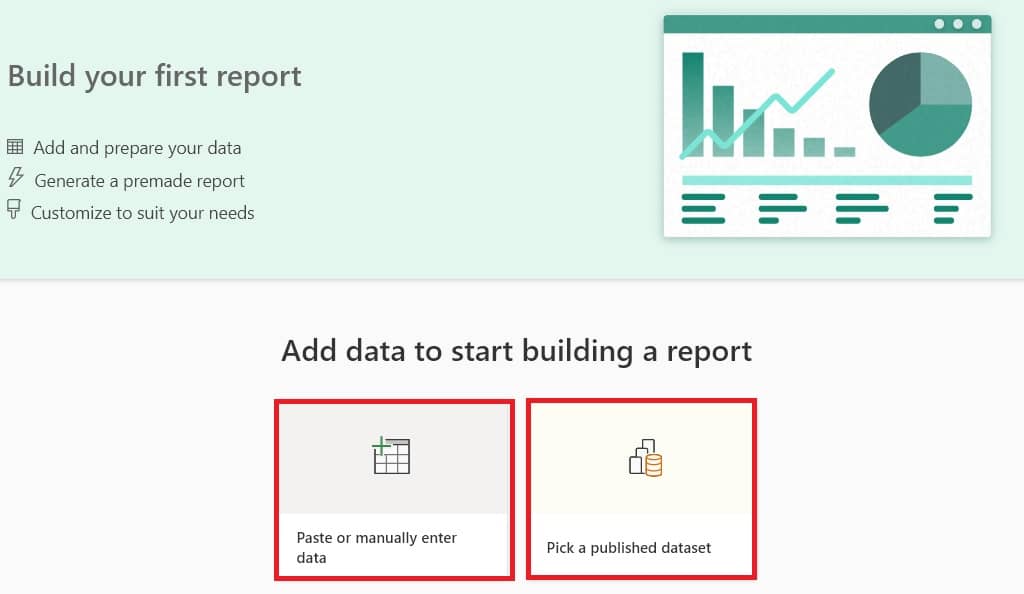
You can choose to add data manually, or published dataset.
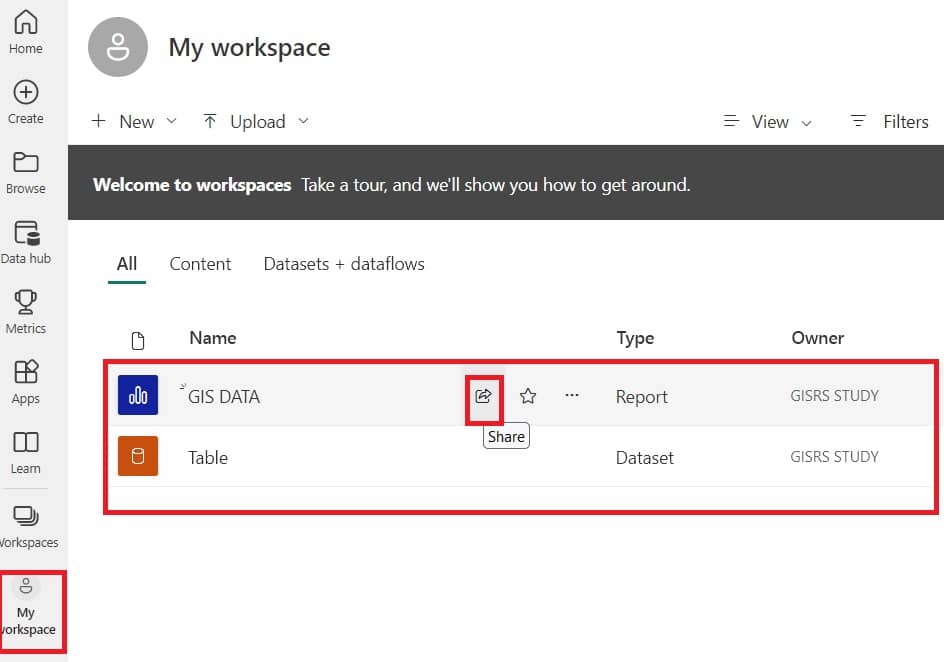
5. See all your dataset and report in My workspace section, also you can Share it.
Conclusion
With ArcGIS for Power BI, you’re not merely viewing data—you’re delving into it. Patterns emerge. Outliers become prominent. Your decisions evolve to be smarter, quicker, and more assured.
In a landscape where every decision is linked to location, can you afford to overlook mapping your future?