ArcGIS Zonal Statistics
What are Zonal Statistics?
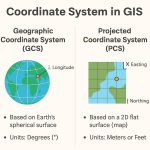
Zonal Statistics in ArcGIS is used to calculate statistics on the values of a raster within the zones defined by another dataset (usually a vector polygon or raster-zone layer). It is commonly used in environmental analysis, land use planning, and other spatial analyses.
Usage
- A zone defined as all areas in the input that have the same value. The areas do not have to be contiguous.
- Both raster and feature datasets can be used for the zone input.
- If the zone input is a raster dataset, it must have an attribute table.
- If the zone input is a feature dataset, a vector-to-raster conversion will be internally applied to it.
An Overview of the Zonal Tools in ArcGIS
The Zonal tools allow you to perform analysis where the output is a result of computations performed on all cells that belong to each input zone.
Some zonal tools quantify certain properties of the geometry, or shape, of the zone input and do not require any other inputs.

| Tool | Description |
|---|---|
| Tabulate Area | The tools determine the area of classes within zones. |
| Zonal Fill | Tools that fill specified zones. |
| Zonal Geometry | Tools that work on zone shapes. |
| Zonal Geometry As Table | Calculates the geometry measures for each zone in a dataset and reports the results as a table. |
| Zonal Histogram | Tools that determine the frequency distribution of values of one input raster within zones of another. |
| Zonal Statistics | Tools that work on zone attributes. |
| Zonal Statistics as Table | Summarizes the values of a raster within the zones of another dataset and reports the results to a table. |
Zonal Statistics Tools in ArcGIS
In ArcGIS Zonal statistics tool helps you to, calculated for each zone defined by a zone dataset, based on values from another dataset.
How Zonal Statistics Tools work
There are two tools that calculate statistics by zones, Zonal Statistics and Zonal Statistics as Table.
- The Zonal Statistics tool calculates only one statistic at a time and creates a raster output.
- The Zonal Statistics as Table tool calculates one or multiple statistics using predefined subsets or all statistics and creates a table output.
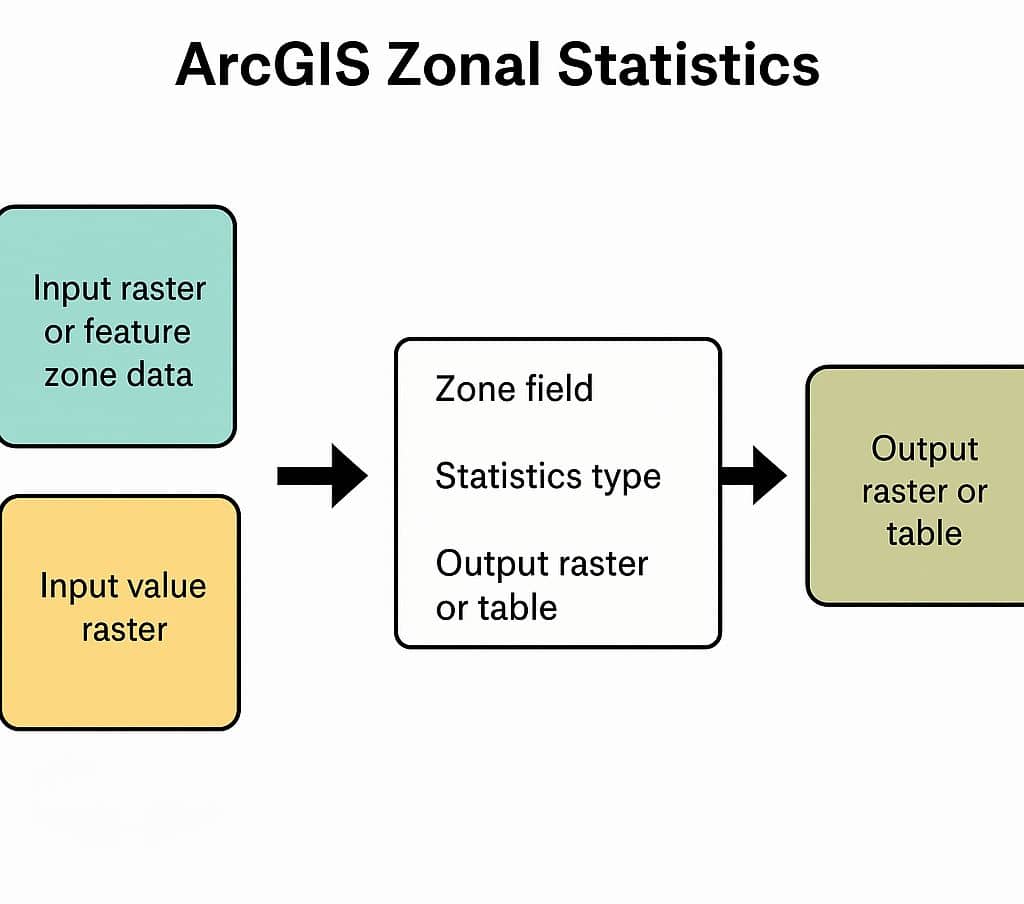
Inputs:
| Parameter | Description |
|---|---|
| Input raster or feature zone data | Defines the zones (e.g., districts, land parcels). Can be vector or raster. |
| Zone field | Field in the zone dataset that defines the zones (e.g., district ID). |
| Input value raster | The raster to summarize (e.g., elevation, temperature, NDVI). |
| Output raster or table | Result of the analysis, either as a raster (Zonal Statistics) or table (Zonal Statistics as Table). |
| Statistics type | Mean, Median, Maximum, Minimum, Range, Majority, etc. |