Vector Data: Geometry of the Real World
What is Vector Data?
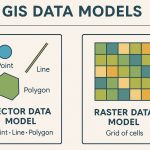
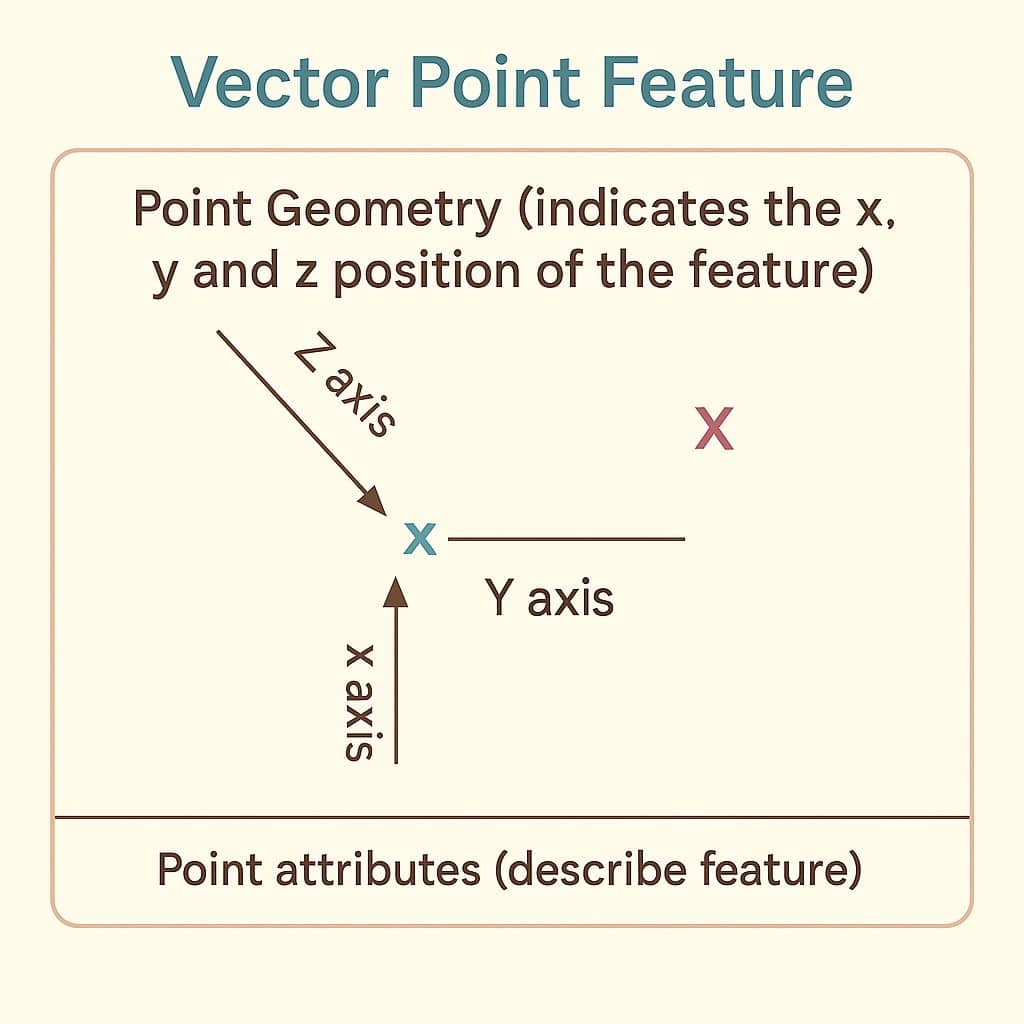
A Vector data feature it represents shape using Geometry. The geometry is made up of one or more interconnected vertices. A vertex describes a position in space using an X, Y and optionally Z axis. Geometries which have vertices with a Z axis are often referred to as 3D since they describe height or depth at each vertex, but not both.
Vector Database is simply XY coordinates. Generally, they are a Latitude and Longitude value. The Vector data represents are points, lines, and polygons.
- A series of x,y coordinates
- For discrete data represented as points, lines, polygons
Vector data is a powerful way to represent real-world objects within a GIS. If you are standing on a hill, the buildings, trees, rivers, and roads that you see below can each be modeled as vector features within a GIS. These features are more than just their shape; they also contain other information, referred to as attributes, which can be words or numbers that characterize the feature.
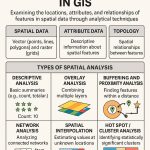
Vector Analysis Examples:
- Buffering: Create zones around points/lines (e.g., schools within 1 km of a road)
- Overlay: Intersect forests with administrative boundaries
- Network Analysis: Shortest path, service area (fire station coverage)
How Geometry Explains Vector Attributes
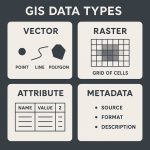
All vector features are of a shape, and the shape is defined by one or more points. A point is a location with X and Y coordinates, sometimes Z (depth or height), so the feature is 2.5 D when Z is present.
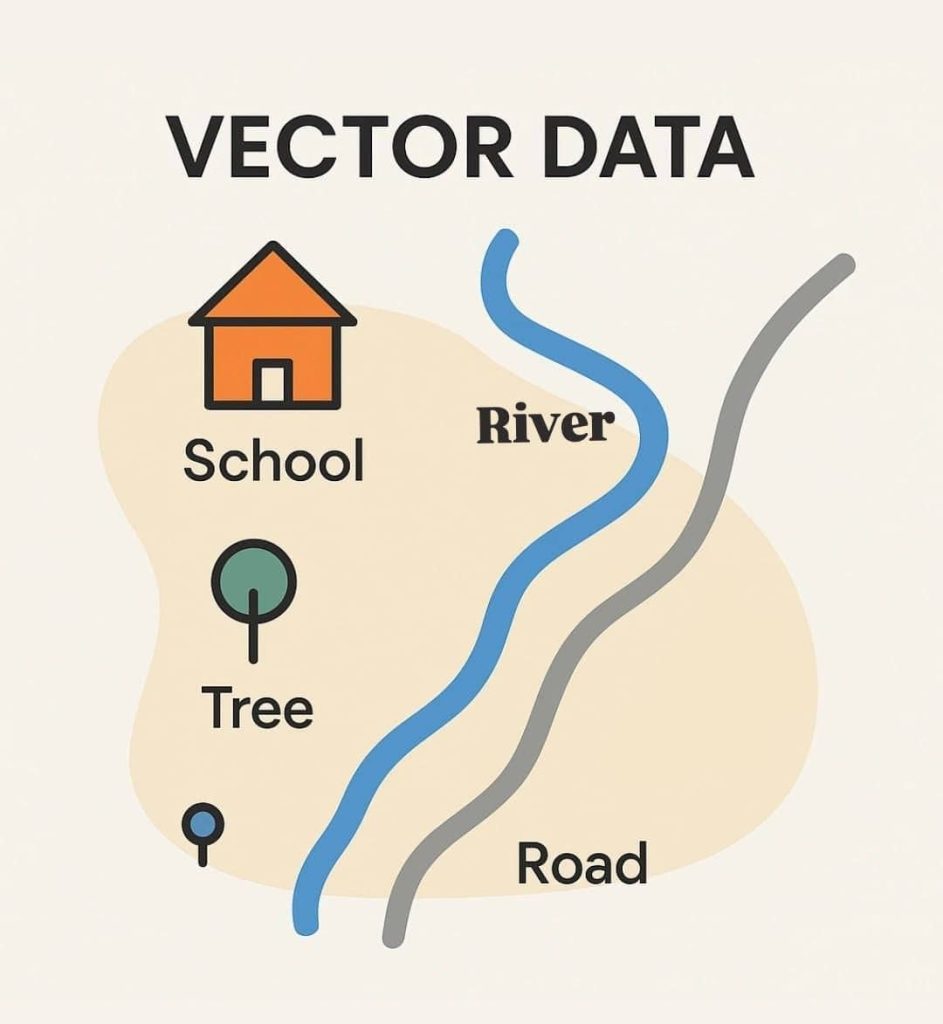
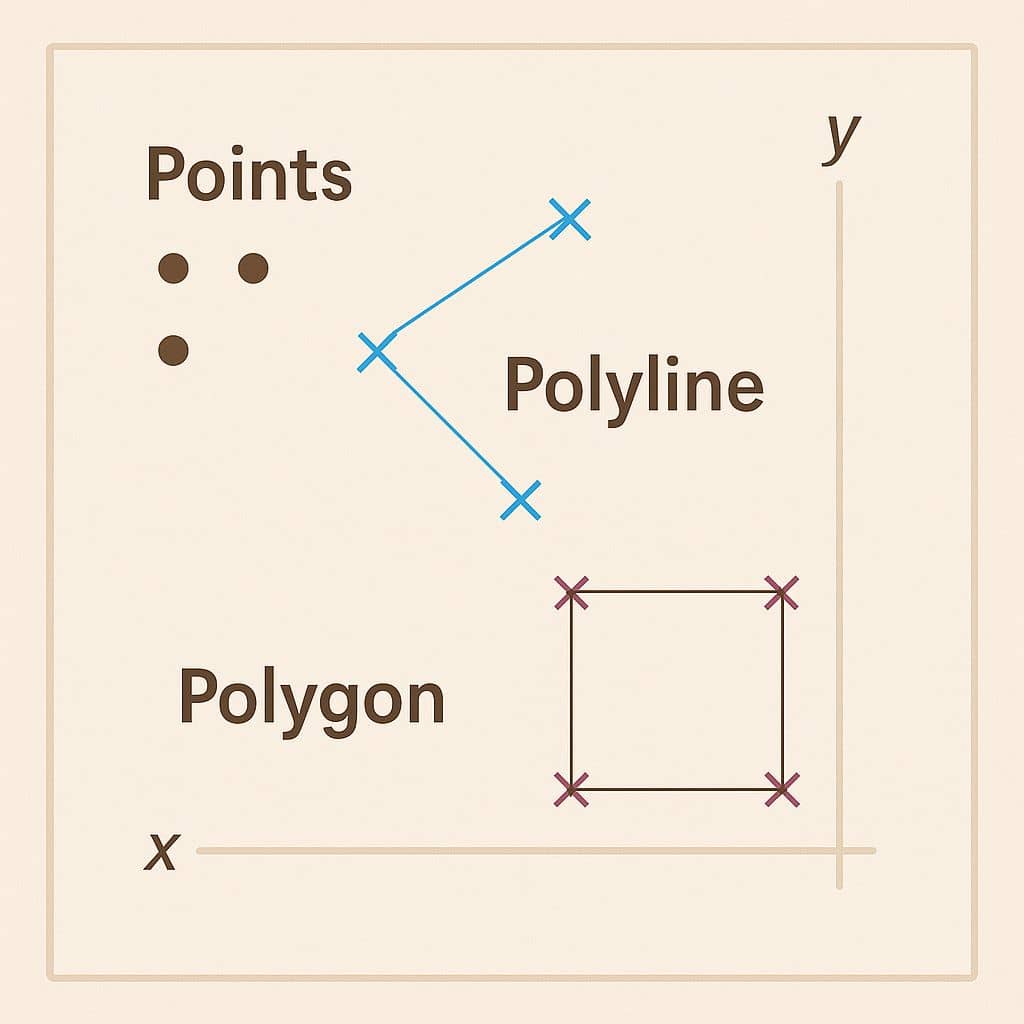
Point
A single dot. Convenient for representing features such as trees, poles, or even cities (on small maps).
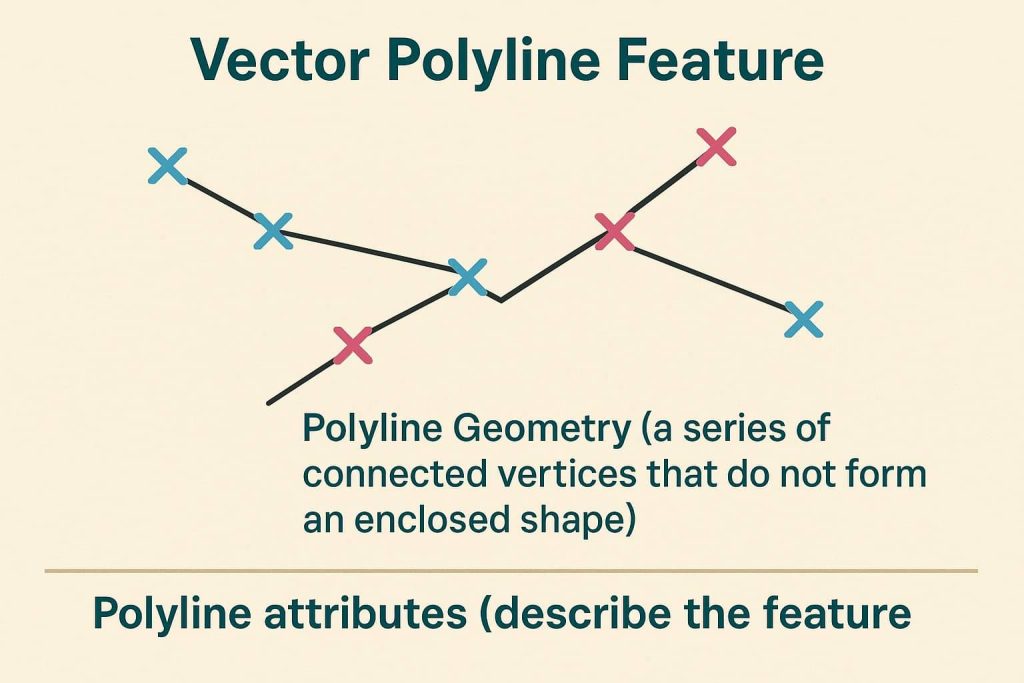
Polyline
Two or more vertices linked that do not form a loop, utilized for linear features such as roads and rivers.
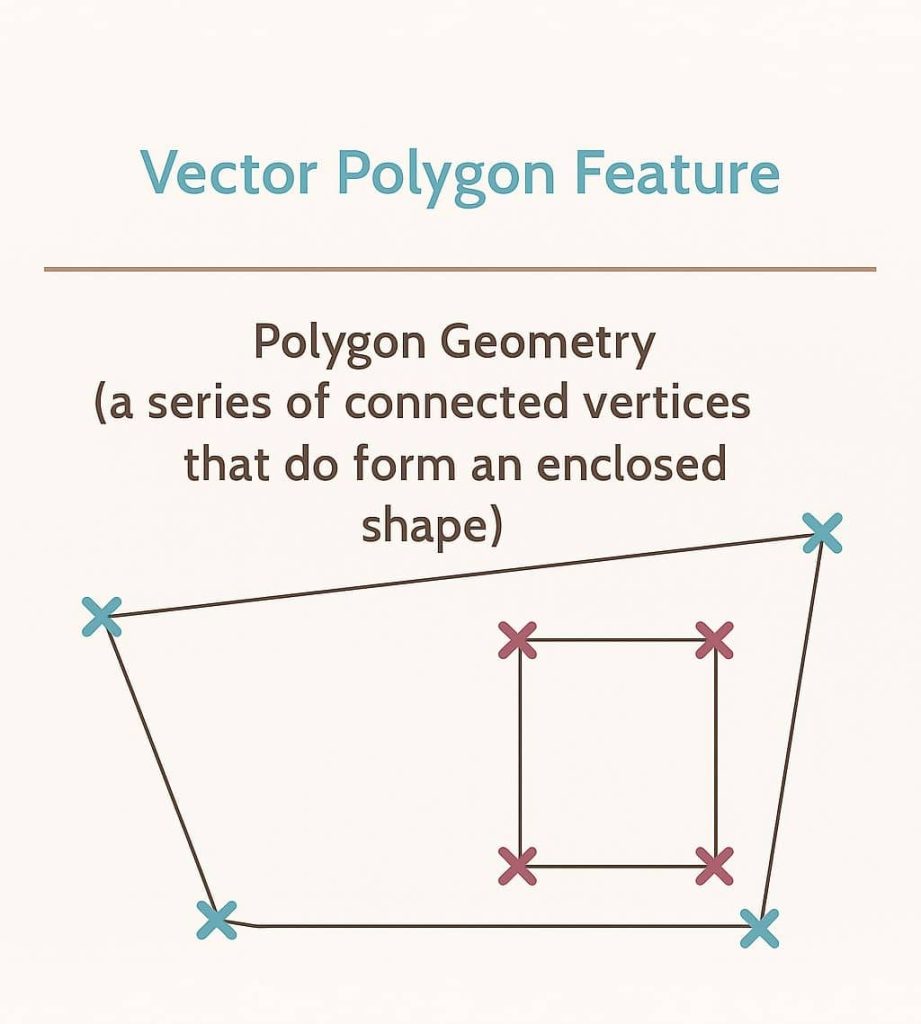
Polygon
A shape where the first and last points are the same. It is utilized to depict areas like buildings or lakes. Each geometry can store attributes: like the name of a city or the length of a road.
Think of vector like your school drawing — sharp, clear shapes with labels.
Choosing the right Geometry Type
The choice of geometry generally depends on scale and usage. A city could be represented as a point on a small map, but as a polygon on a large map. More small objects, like light poles, are better represented as points, but roads or rivers are better represented with polylines.
Points and coordinate systems
All point features are based on a Coordinate Reference System (CRS) in order to position it on the Earth’s surface. The most common CRS uses Latitude and Longitude, where Latitude denotes the north-south position and Longitude the east-west. By adding a Z value (height), we can now define the height of features such as hills or buildings.
Polyline Data
Polylines are especially well designed to depict networks or continuous features such as roads, rivers, or contour lines. These are created by linking several vertices. Yet, if the vertices get too far apart, curved features become ragged. Therefore, when digitizing polylines, vertices must be positioned close enough to depict them accurately at the intended map scale.
Polygon Data
Polygon features include enclosed areas like dams, islands, national boundaries etc. Like polyline features, polygons are defined by a list of vertices enclosed by a continuous line. But because a polygon is always defining an enclosed area, the first and last vertices will always be in the same location! Polygons have shared geometry –– boundaries they share adjoining polygon. A polygon can also possess attributes. Attributes characterize a polygon. For example, a dam can possess attributes to describe depth and water quality.
Vector File Formats
- .shp (Shapefile) – still widely used
- .geojson – perfect for web maps
- .kml – used in Google Earth
- .gml – XML-based, for data exchange
| File Formats | Full Form |
|---|---|
| E00 | Arc Export |
| COVERAGE | Arc/INFO Coverage |
| CGM | Computer Graphics Metafile |
| DWG | AutoCAD Drawing file |
| DXF | Data Interchange File |
| HPGL | Hewlett Packard Graphic Language |
| GDB | Geodatabase |
| MDB | Personal Geodatabase |
| MIF/MID | Mapinfo Data Transfer Files |
| SVG | Scalable Vector Graphics |
| ODG | OpenDocument Graphics |
| DGN | MicroStation Design File |
| SDTS | Spatial Data Transfer System |
| TIGER | Topological Integrated Geographic Encoding and Referencing |
| SHP | Shapefile |
| VPF | Vector Product Format |
| VML | Vector Markup Language |
| CDR | CorelDRAW |
| HVIF | Haiku Vector Icon Format |
| AMF | Additive Manufacturing File Format |
Why Use Vector Data?
- Compact storage of data
- High level of detail and precision
- Scalable for high-resolution output
- Ideal for detailed analysis
Aside from basic visualization, vector data can be used to perform spatial analysis — asking and answering complex questions like:
What are the houses in the flood-risk area?
Where would a hospital be ideally located to reach most people effectively?
Which pupils live in a specific suburb?
These kinds of queries demonstrate the analytical power of GIS.
The Role of Scale in Vector Data
Scale is also crucial in the case of approximating vector features. Map information on a small scale can be insufficient for local detailed planning. For instance, in detailed planning of a wetland reserve, coarse-scale information used might not include important components of the ecosystem. Always ensure the data scale is compatible with application needs.
Challenges and Common Mistakes
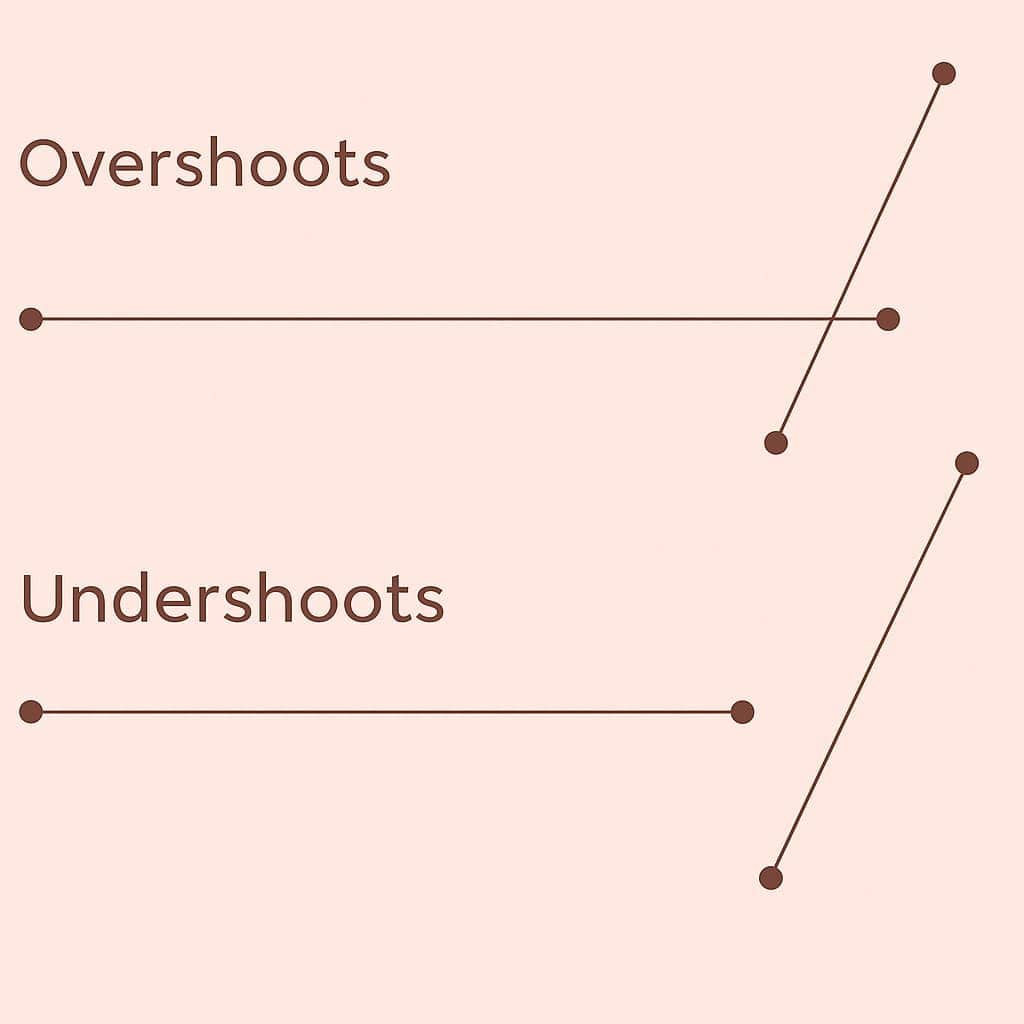
Working with vector data is not without challenges. Precision relies on accurate data gathering. There are chances of errors with poor instruments, human error, or insufficient detail in digitizing. Geometric errors more frequently encountered are:
Overshoots: Lines that go beyond where they meet.
Undershoots: Lines that do not intersect where they are supposed to. These types of errors can interfere with analysis and should be corrected during the process of topology validation, which we will elaborate on later.
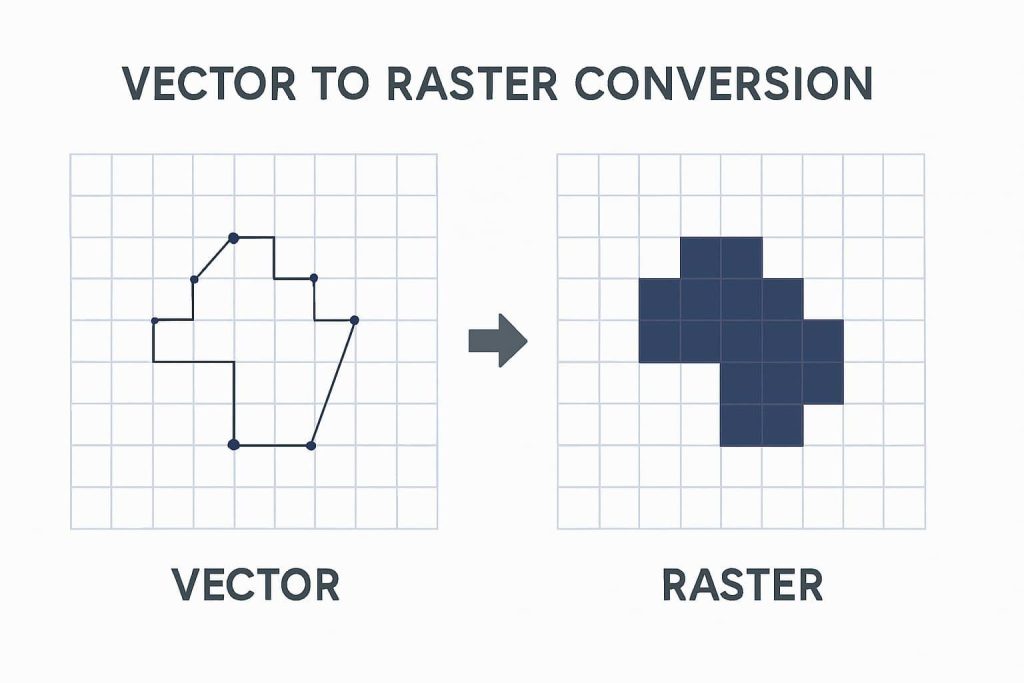
Converting Vector to Raster: From Shapes to Grids
Sometimes in GIS, we need to change the way we store and use data—especially when working with models that need a grid-like format. That’s where vector to raster conversion comes in.
Vector data is great for showing exact locations and shapes. But when you’re running certain types of analysis—like modeling water flow, analyzing land use patterns, or overlaying layers—it’s often easier to use Raster data, where the world is divided into a grid and each cell has a value.
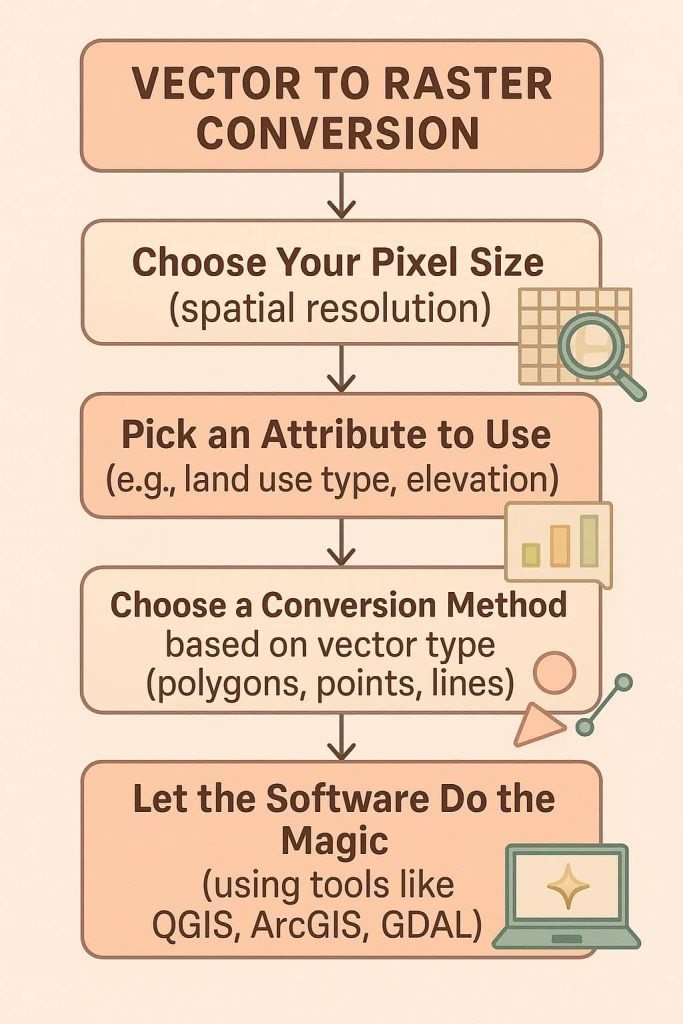
Why Convert to Raster?
Let’s say you have a land use map made of polygons showing forests, farms, and urban areas. Converting that into a raster means every small square (pixel) on the map will hold a value like “forest” or “urban.” This makes it much easier for a computer to process in things like environmental or surface modeling.
A few examples:
- In environmental studies, converting land cover to raster helps with tasks like calculating water runoff.
- In urban analysis, it can help show population density or access to services more clearly.
How Does the Conversion Work?
Vector conversion in QGIS
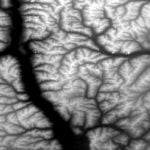
Step: 1– Load the Sentinel-2 Image
Open QGIS, Go to Layer > Add Layer > Add Raster Layer.
Load bands 4 (red), 3 (green), and 2 (blue).
Use the “Built Virtual Raster” tool to combine them.
Step: 2– Zoom into Your Area of Interest
Pick a small, clearly visible feature like a lake, forest patch, or built-up area.
Zoom in enough so you can easily trace its shape.
Step: 3– Create a New Vector Layer
Go to Layer > Create Layer > New Shapefile Layer.
Choose the geometry type (Polygon, for example).
Set the coordinate reference system (match it to your raster, e.g., EPSG: 32643 for Sentinel-2 in India).
Add an attribute (e.g., “Feature Type”).
Step: 4– Start Digitizing (Vectorization)
Right-click on the new shapefile > Toggle Editing.
Click the Add Polygon Feature tool.
Carefully trace the feature (click to add vertices, right-click to finish).
In the pop-up, enter a name or label (e.g., “Water Bodies”).
Pro Tip: You can digitize multiple features (e.g., multiple patches of urban area, forest) and give each a separate label in the attribute table.
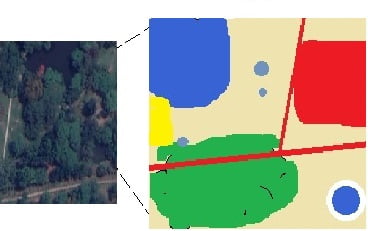
Step: 5– Save Your Work
Click Toggle Editing again and choose Save Changes. You now have a vector layer extracted manually from your Sentinel-2 raster!
Here you can see a side-by-side comparison of the original raster image and the digitized vector version.
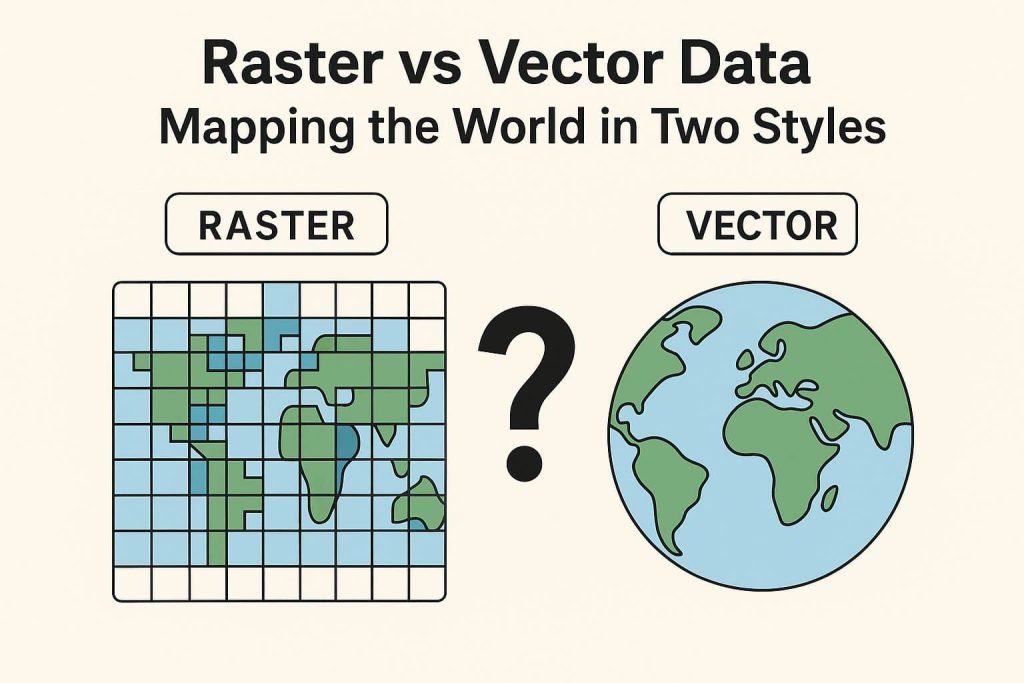
Vector Data vs Raster Data
| Raster Data | Vector Data |
| Advantages | |
| Easy and efficient overlaying. Compatible with remote sensing imagery. Efficient to represents continuous data. Simple data structure. | Smaller file size Editing is very Easy. Proper identity for discrete objects, like point, line or polygon. Efficient Topological relationship. Accurate projection transformation. |
| Disadvantages | |
| Difficult overlay operations. Not Compatible with remote sensing imagery. That is Not proper represents continuous data. Complex data structure. | Larger file size. Difficult to edit. It’s a pixel series, so not accurate identity the objects. Did not build Topological relationship. Inefficient projection transformation. |
Tools You’ll Use:
| Tool | Raster or Vector? | Purpose |
|---|---|---|
| QGIS | Both | Editing, visualizing, converting |
| Google Earth Engine | Raster | Cloud-based analysis |
| PostGIS | Vector | Database analysis |
| SNAP | Raster | Remote sensing |
| GDAL | Both | Format conversions |
When to Use What?
| Situation | Use Vector If… | Use Raster If… |
|---|---|---|
| Land records? | ✔ Precise boundaries | ❌ Not needed |
| Forest fire detection? | ❌ Not exact shapes | ✔ Satellite image analysis |
| Route planning? | ✔ Network of roads | ❌ Overkill |
| Crop health monitoring? | ❌ | ✔ NDVI from satellite imagery |
Advantages of Vector Models
For the purpose of depicting linear lines and feature boundaries, vector models are the clear best choice.
First, the visual model tends to be far more aesthetically pleasing, especially considering the fact that raster models can actually look very pixelated if resized.
Vector objects like points, lines, and polygons, however, may be enlarged or minimized without sacrificing quality.
Second, if several data fields and attributes must be accommodated, vector models are once more the best choice, as vector data points may hold an enormously high number of attributes as required.
Vector Data’s Contribution to City Planning and Management:
The most important use of vector data is in urban management and planning.
Cities and municipalities rely on vector data to generate high-resolution maps indicating property lines, zoning districts, and infrastructure networks. To illustrate, when they redevelop an overpopulated downtown site, planners employ vector-based GIS to delineate current buildings (as polygons), road networks (as lines), and public facilities such as parks and fountains (as points).
The level of detail presented allows for effective land use, infrastructure, and resource allocation planning. By analyzing vector data, urban planners are able to predict traffic flow impact of new constructions, compute the need for more public facilities, and maximize compliance with sustainable development principles.