Heatmap in GIS: QGIS
What is a Heatmap?
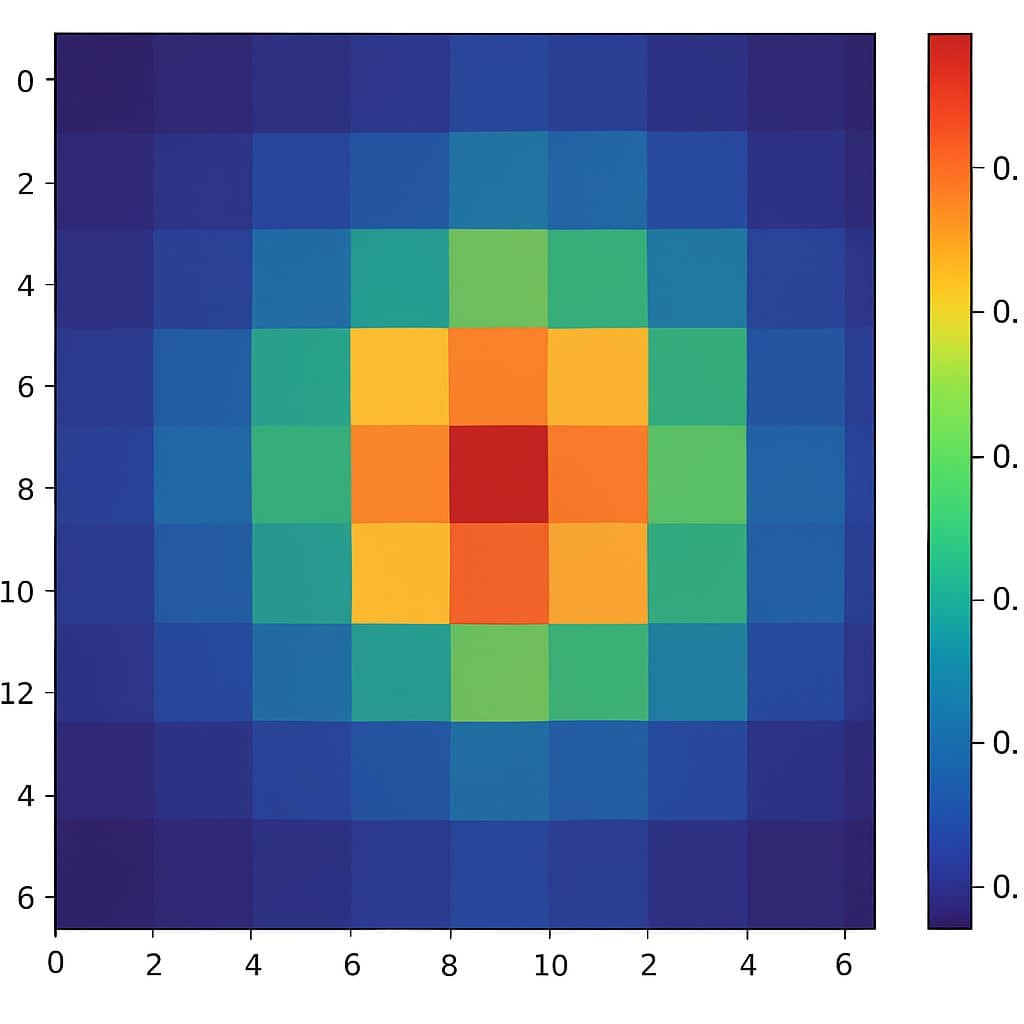
A Heatmap is an interpolation technique useful in determining the density of input features. In GIS (Geographic Information Systems), it is often used to represent the density or intensity of spatial data (e.g., crime hotspots, traffic accidents, population distribution).
Common Uses of Heatmaps
- Environmental Studies – Show temperature, pollution, or vegetation levels.
- Urban Planning – Identify areas with high traffic or pedestrian flow.
- Crime Mapping – Highlight high-crime areas.
- Marketing – Visualize customer concentration.
- Web Analytics – Show areas of a webpage that users interact with most (in UX/UI design).
Heatmap in QGIS
In this Tutorial Learn, how to create Heatmap in QGIS.
Heatmap Plugin in QGIS
Heatmap plugin is needed to install are you use to QGIS old version. But if used to a new version of QGIS (3.10, 3.12, 3.14, 3.243, …3.34) is automatically installed and activated Heatmap. In this Tutorial, use QGIS software, the latest version 3.34.
How to Install Plugin in QGIS:
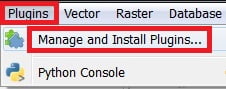
Click on the Plugin menu and select manage and Install plugins.
Plugins window appears, Type plugin name (Ex. Heatmap) in the search box, and Install plugin button.
Create Heatmap in QGIS Software
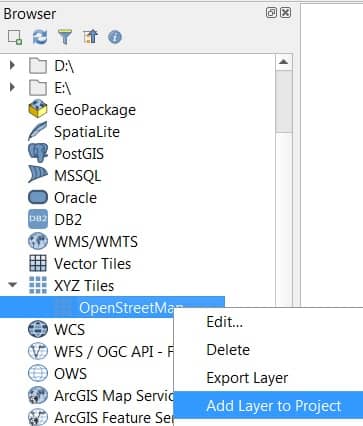
First, load a Basemap layer from the Browser panel.
Select OpenStreetMap layer under XYZ Tiles, Right-click, and select Add Layer to project.
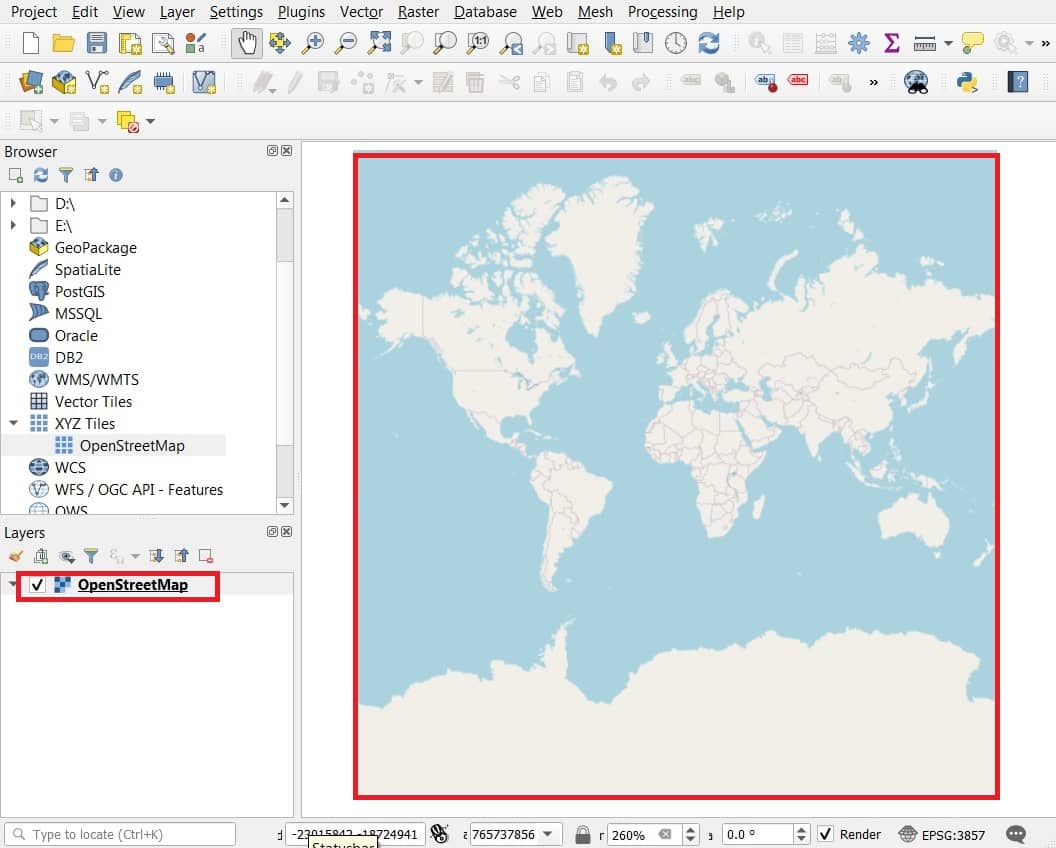
Now you can see add OpenStreetMap in QGIS Map view area, as well as Layer panel.
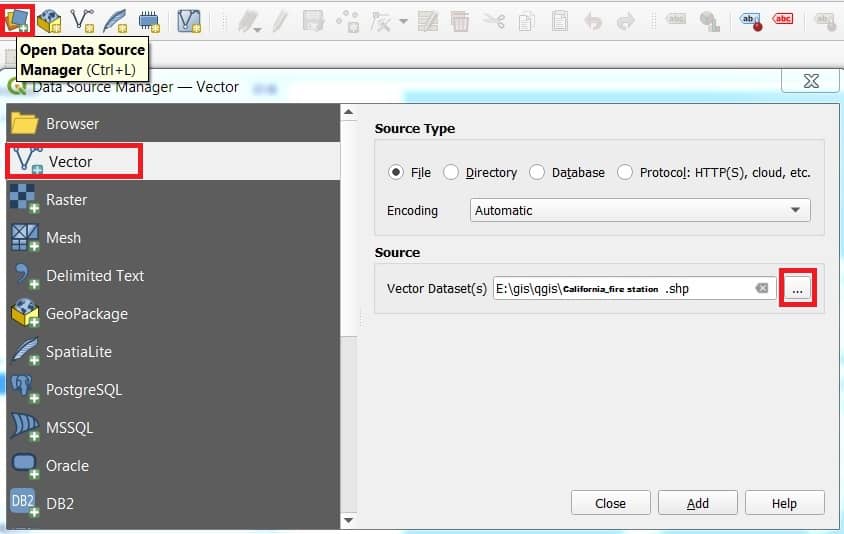
Now Add Data, click the Open Data Source Manager button. Select Vector, and Browse the Data (Ex. California_Fire stations.shp), and click Add button.
Another Data format Add, like Data, is CSV format. Click the Open Data Source Manager button. Select Delimited Text, and Browse the Data (Ex. California_Fire stations.csv). Automatically generate X (Latitude) and Y(Longitude) field. You can manually select these options.

You will see 2 layers – OpenStreetMap and California_Fire Station in the QGIS Layers panel. Right-click California_Fire station layer and select Zoom to Layer.
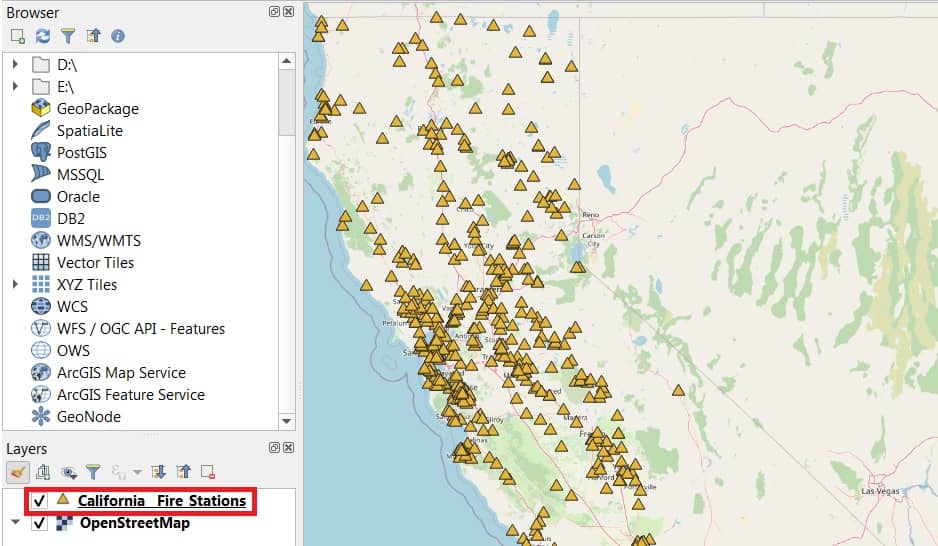
The data is quite dense and it is hard to get an idea of where there is a high concentration of Fire stations. This is where a Heatmap visualization will come in handy.
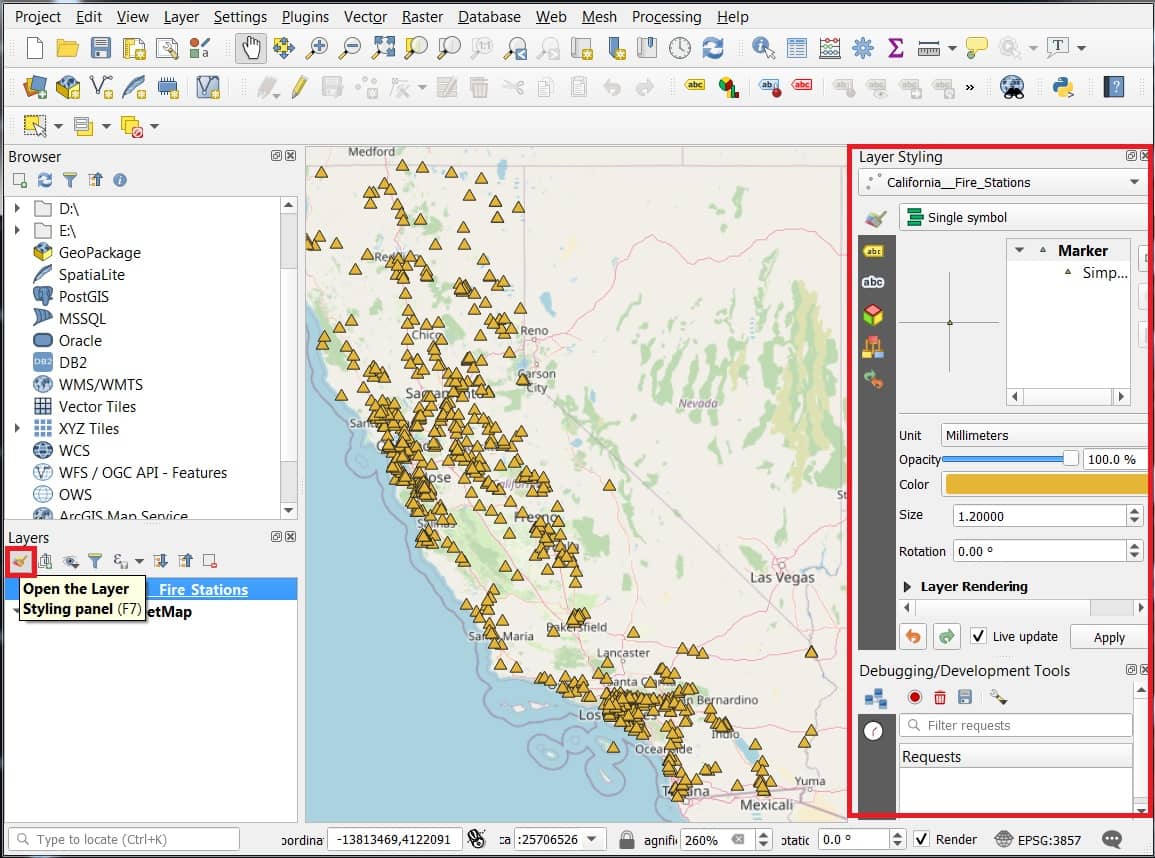
Select the California Fire Station layer and click the Open the Layer Styling panel button. You can also open properties to the Right-click.
The data is quite dense and it is hard to get an idea of where there is a high concentration of Fire stations. This is where a Heatmap visualization will come in handy.
Select the California Fire Station layer and click the Open the Layer Styling panel button. You can also open properties to the Right-click.
Now you can see on the right side the Layer properties window appears.
Select Heatmap as the renderer in the dropbox menu. The Layer Styling panel is interactive and you can see the effect of your changes reflected in the Map view immediately.
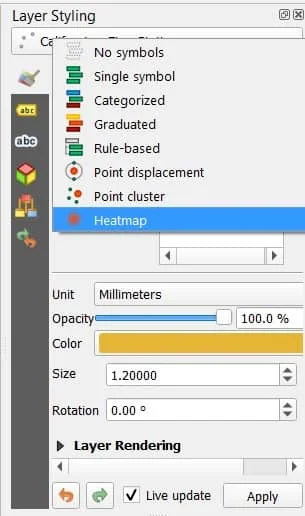
The layer will now be displayed in the default grayscale color-ramp. You choose the different types of color-ramp (Ex. Reds).
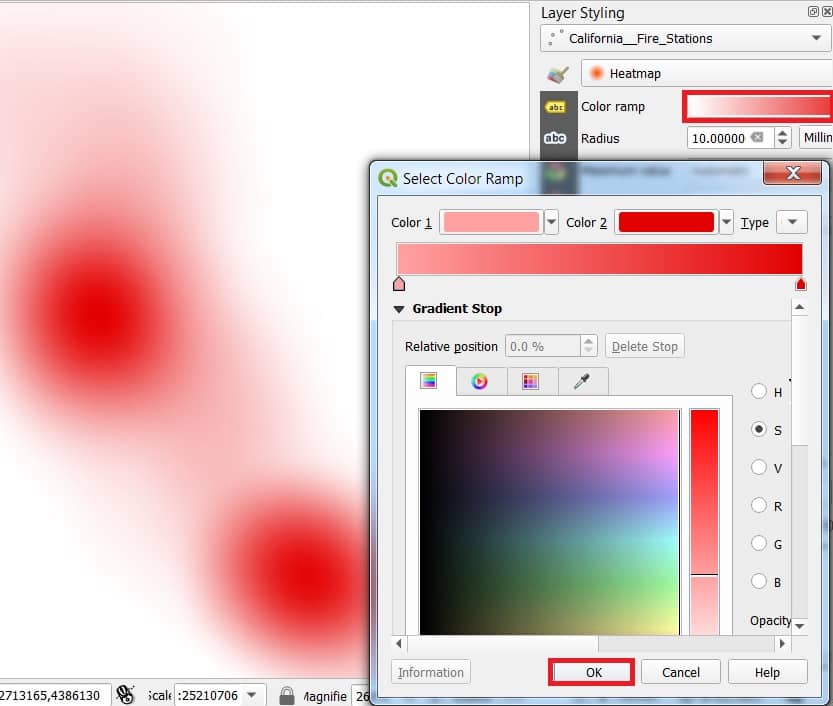
The deep reds identify the highest density area of Fire Station.
Now set Radius value, change Opacity (50%), Blending value (Difference) to a better understanding Heatmap.


It is very nice content sir <3 and I would like to ask if you have a process in mapping ventilation using ArcGIS? Thnak you so much for your response sir 🙂
Thank you, please follow my website for better content in future.