Summary: – The Thematic Mapper (TM) is a multispectral scanning sensor that was introduced aboard the Landsat 4 and Landsat 5 satellites. The TM sensor captures imagery in seven spectral bands, with a spectral and spatial resolution.
Thematic Mapper Sensor: Landsat TM
The Thematic Mapper (TM) is a powerful imaging sensor that was part of NASA’s Landsat Earth observation program. It played a major role in helping scientists, researchers, and environmentalists understand our planet by capturing detailed satellite images for several decades.
Introduction and Historical Background
Thematic Mapper (TM) is an advanced multispectral scanning, Earth resources Sensor. It’s designed to achieve higher image Resolution, sharper spectral separation, improved geometric fidelity and greater radiometric accuracy and resolution than the MSS Sensor.
The TM sensor was first launched aboard Landsat 4 in 1982, followed by another identical sensor on Landsat 5, which remained in operation until 2013. These satellites were part of the long-running Landsat program, designed to observe and monitor Earth’s surface. Even though Landsat 4 was decommissioned in 2001, Landsat 5 continued to function, collecting valuable data until early 2012. TM was developed to be a major improvement over the older Multispectral Scanner (MSS), which had flown on Landsat 1 through Landsat 3. The MSS sensor was limited in its capabilities, and scientists already recognized the need for better performance before Landsat 1 even launched in 1972. TM was designed as a second-generation Earth observation instrument, and it delivered significantly better spatial, spectral, geometric, and radiometric resolution than its predecessor.
TM sensor records reflected and emitted electromagnetic energy from the visible, reflective-infrared, middle-infrared, and thermal-infrared regions of the spectrum.
TM had a swath width of approximately 185 km from a height of approximately 705 km. It is useful for vegetation type and health determination, soil moisture, snow and cloud differentiation, rock type discrimination.
Launch of Landsat 4 and Landsat 5 with TM Sensor
Landsat 4 launched on July 16, 1982, with the first TM sensor.
Landsat 5 followed on March 1, 1984, with a duplicate TM sensor that remained operational until June 5, 2013 — a phenomenal 29-year run.
These missions were part of NASA’s Earth observation initiative to build a continuous, comprehensive record of Earth’s changing surface.
Built the Thematic Mapper
Santa Barbara Research Center & Hughes Aircraft Co.
The TM sensor was built by the Santa Barbara Research Center (SBRC) — a division of Hughes Aircraft Company, California. They engineered the device in collaboration with NASA, combining aerospace tech with Earth science.
Whiskbroom Scanning
The Thematic Mapper (TM) sensor on board Landsat satellites uses a scanning technique known as whiskbroom scanning. This method involves a single detector (or a small set of detectors) that physically moves side to side across the satellite’s path of travel. Imagine a broom sweeping back and forth over a floor — as the satellite moves forward along its orbit, the sensor sweeps across the Earth’s surface, capturing one narrow strip of data at a time. Each of these narrow strips is called a scan line. As the satellite continues to progress, thousands of these scan lines are collected and stitched together to form a complete, continuous image of the landscape below.
The whiskbroom scanner captures high-resolution data with consistent quality across the swath, making it highly effective for detailed analysis of land use, vegetation, urban expansion, and environmental monitoring. Although the mechanical movement of the scanner introduces some complexity and potential wear over time, this method offers precise spatial resolution and uniformity. The consistency in data capture from one scan line to the next helps ensure accurate comparisons over time, which is vital in applications like change detection, land cover classification, and long-term environmental monitoring. Thus, whiskbroom scanning plays a crucial role in the success of TM imaging.
Evolution from MSS to TM
Limitations of MSS:
Before TM, the Multispectral Scanner (MSS) on board Landsat 1–3 could only detect four spectral bands at coarse resolution. It was sufficient for basic terrain and vegetation mapping but lacked depth.
TM as a Second-Generation Sensor:
The TM was developed to address these gaps. It had:
- 7 spectral bands vs. MSS’s 4
- 30 m resolution vs. MSS’s 80m
- Improved radiometric sensitivity for detailed surface analysis
TM Bands
- Bands 1, 2, and 3 are in the visible portion of the spectrum and are useful in detecting cultural features such as roads. These bands also show detail in water.
- Bands 4, 5, and 7 are in the reflective-infrared portion of the spectrum and can be used to differentiate between land and water.
- Band 6 is in the thermal portion of the spectrum and is used for thermal mapping.
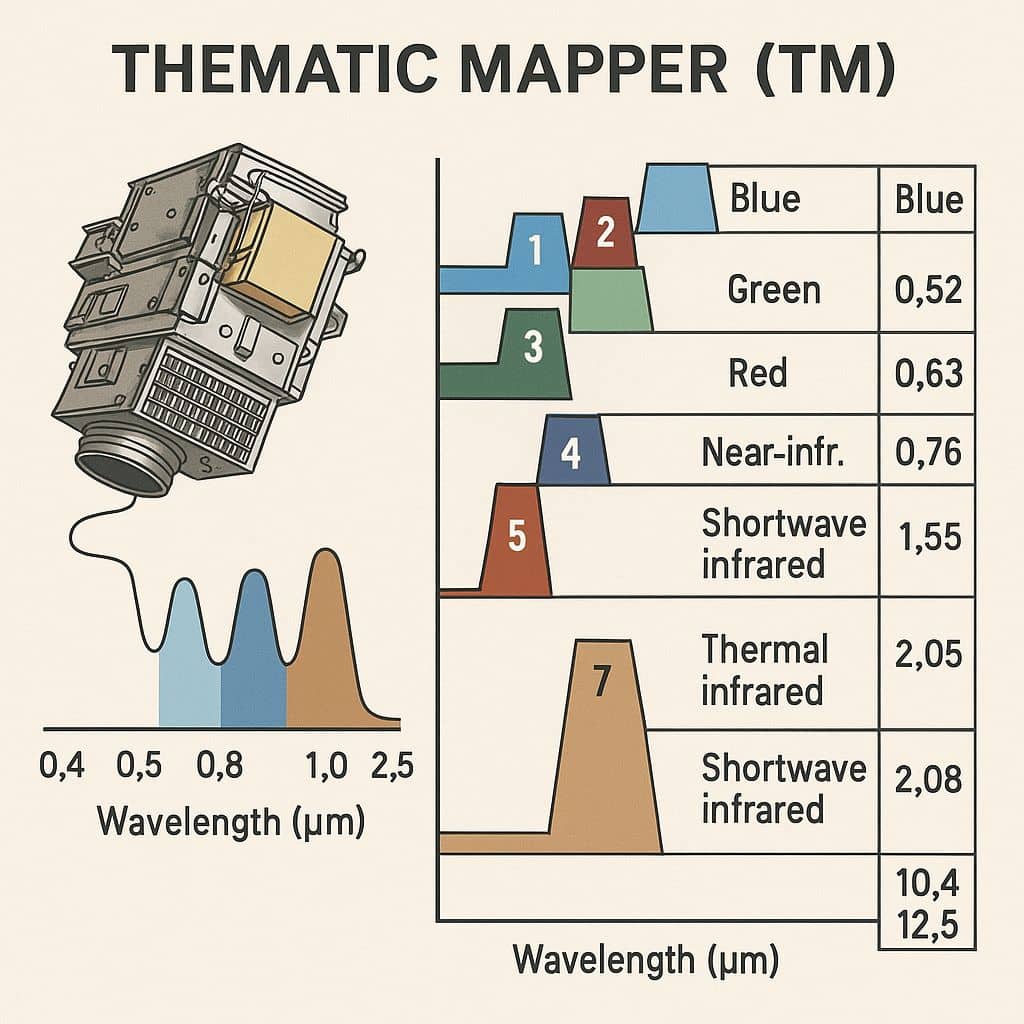
Spectral Bands of TM:
Detectors recorded EMR in 7 bands:
| Band | Spectral Range (µm) | Spectral Region | Resolution (m) | Application |
|---|---|---|---|---|
| 1 | 0.45–0.52 | Visible (Blue) | 30 | Coastal water mapping, soil/vegetation differentiation, chlorophyll absorption |
| 2 | 0.52–0.60 | Visible (Green) | 30 | Green reflectance peak, healthy vegetation, plant vigour |
| 3 | 0.63–0.69 | Visible (Red) | 30 | Chlorophyll absorption, plant type discrimination |
| 4 | 0.76–0.90 | Near Infrared (NIR) | 30 | Biomass surveys, water body boundary detection |
| 5 | 1.55–1.75 | Shortwave IR (SWIR) | 30 | Vegetation moisture, snow/cloud differentiation |
| 6 | 10.4–12.5 | Thermal IR (TIR) | 120 (resampled to 30) | Plant heat stress, thermal and soil mapping |
| 7 | 2.08–2.35 | Shortwave IR (SWIR) | 30 | Hydrothermal mapping, geological analysis |
Band Specifications:
- Sensor type: opto-mechanical
- Spatial Resolution: 30 m (120 m – thermal)
- Spectral Range: 0.45 – 12.5 µm
- Number of Bands: 7
- Temporal Resolution: 16 days
- Image Size: 185 km X 172 km
- Swath: 185 km
- Programmable: yes
TM Resolution
Spatial Resolution of TM is 28.5 × 28.5 m for all bands except the thermal (band 6), which has a spatial resolution of 120 × 120 m. The larger pixel size of this band is necessary for adequate signal strength. However, the thermal band is resampled to 28.5 × 28.5 m to match the other bands. Radiometric Resolution is 8-bit. That each pixel has a possible range of data values from 0 to 255.
Spectral Resolution:
Seven spectral bands:
- Bands 1 to 3: These fall in the visible light spectrum (similar to what human eyes can see).
- Bands 4, 5, and 7: These are in the near and mid-infrared spectrum, which are useful for analyzing vegetation, water, and soil.
- Band 6: This is a thermal infrared band, designed to sense heat energy, making it valuable for studying surface temperatures, volcanic activity, and urban heat zones.
Spatial and Radiometric Resolution:
Resolution per Band:
Most bands on TM deliver imagery at 30-meter resolution, which means each pixel represents a 30×30 meter ground area. Its radiometric resolution is 8-bit, allowing 256 levels of grayscale, which enhances the ability to detect subtle differences in surface features, making it valuable for land cover and environmental monitoring.
Resampling of Band 6:
Originally, Band 6 had a 120-meter resolution. However, it was resampled to 30 meters to match the others for easier integration and analysis.
Temporal Resolution and Coverage:
16-Day Repeat Cycle of Landsat TM
Landsat 4 and 5 followed a 16-day cycle, revisiting the same location every 16 days, enabling temporal change analysis over months or years.
Worldwide Reference System-2 (WRS-2) The Worldwide Reference System-2 (WRS-2) is a global indexing framework that organizes the Landsat Thematic Mapper (TM) sensor’s data acquisition using a Path/ Row system, which functions like a grid of geographic coordinates to define the satellite’s scanning schedule; this structured approach allows for consistent, repeatable, and systematic coverage of the Earth’s surface, facilitating effective tracking of satellite orbits, synchronization of image acquisition.
| Parameters | Description |
|---|---|
| Image Size | 185 km × 172 km |
| Swath | 185 km |
| Programmable | Yes |
Product Processing Parameters:
| Parameters | Details |
|---|---|
| Product Type | Level 1 Corrected (L1T) |
| Output Format | GeoTIFF |
| Resampling Method | Cubic Convolution (CC) |
| Map Projection | UTM – WGS 84 (Polar Stereographic for Antarctica) |
| Image Orientation | Map (North Up) |
| Distribution | HTTPS Download Only |
| Delivery Time | Immediate download |
| Processing System | LPGS (most scenes), NLAPS (before April 15, 2009, for Landsat 4) |
Landsat 4-5 TM Collection 1 Tier System:
| Tier | Description |
|---|---|
| Tier 1 | Highest quality (L1TP), suitable for time-series analysis; RMSE < 12 meters |
| Tier 2 | Lower quality (includes L1TP not meeting Tier 1, L1GT, and L1GS scenes); users must assess suitability |
| NLAPS | TM data processed before April 15, 2009 (Landsat 4) are not part of Collection 1 |
Legacy of TM:
- ETM+ on Landsat 7 (1999)
- OLI/TIRS on Landsat 8 (2013)
- Landsat 9 (2021) — direct descendant of TM tech
Major Applications of Thematic Mapper
- Environmental Monitoring
- Deforestation
- Coastal erosion
- Desertification
- Wetland changes
- Urban Expansion and Land Use
Different Megacities worldwide like Delhi, Beijing, and São Paulo were studied over decades to understand urban sprawl, zoning, and green loss.
- Agriculture and Forestry
- Crop health and yield estimation
- Irrigation mapping
- Pest and disease detection
- Heat Zones and Volcanic Monitoring
Band 6 of TM sensor could detect wildfire hotspots, volcanic activity, and urban heat islands long before drones or thermal cameras became widespread.
Calculating Temperature from TM Data
Role of Band 6 in Thermal Studies–
Band 6 was crucial for thermal mapping. But raw satellite data isn’t in temperature format — it’s in spectral radiance. The equation is stated below:
Formula of Temperature Conversion–
Here’s a simplified version of the formula often used:
T = (14,400 × λ) / ln [(3.742 × 10⁷ × π) / (λ⁵ × L6) + 1]
Where:
T = Temperature in Kelvin
λ = Average wavelength (~11.5 µm)
L6 = Spectral radiance from Band 6
Explanation of Planck’s Equation–
This formula is derived from Planck’s Law, which explains how bodies emit radiation based on temperature. By reversing it, we can figure out temperature from radiation.
Example of Temperature Calculation–
Let’s say:
L6 = 10 W/m²/sr/µm
λ = 11.5 µm
The temperature we can get in Kelvin. Convert to °C by subtracting 273.15.
Conclusion
The Thematic Mapper (TM) was not just a sensor—it was a revolutionary tool that transformed the way we observe and understand our planet. For more than 30 years, TM silently orbited the Earth while collecting precise images in seven spectral bands from the Landsat 4 and 5 satellites. With the use of these images, scientists and researchers were able to monitor important environmental changes, such as the rapid urbanisation of places, the devastation of rainforests, the diminishing of water bodies, and the stress on agriculture. By mapping soil moisture, detecting plant heat stress, and monitoring wildfires, its thermal imaging capacity proved to be a crucial tool for agricultural planning and disaster management. Decades of Earth observation science was made possible by the TM’s consistent and trustworthy data, which backed many research and development initiatives around the globe.