Land Use Mapping in GIS
Introduction
A Land Use Mapping in GIS visually represents how different areas of land are utilized by humans. It’s created using geographic data in layers, and is vital in planning, environmental studies, and land management..
GIS Land Use Map is a specific type of mapping technology that allows you to analysis and customizable combinations of data layers in a GIS tools.
The Geodatabase with its associated GIS softwares supports the land administration life, data capture, data management and processing.
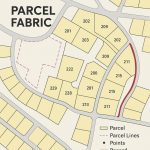
Download Land Use Maps
Download Satellite imagery data (Land use/Land cover data), then analysis the data.
Land use Map Tutorial
In this tutorial we will show how the change land use over the period, with the help of Erdas Imagine software’s, Supervised Classification method.
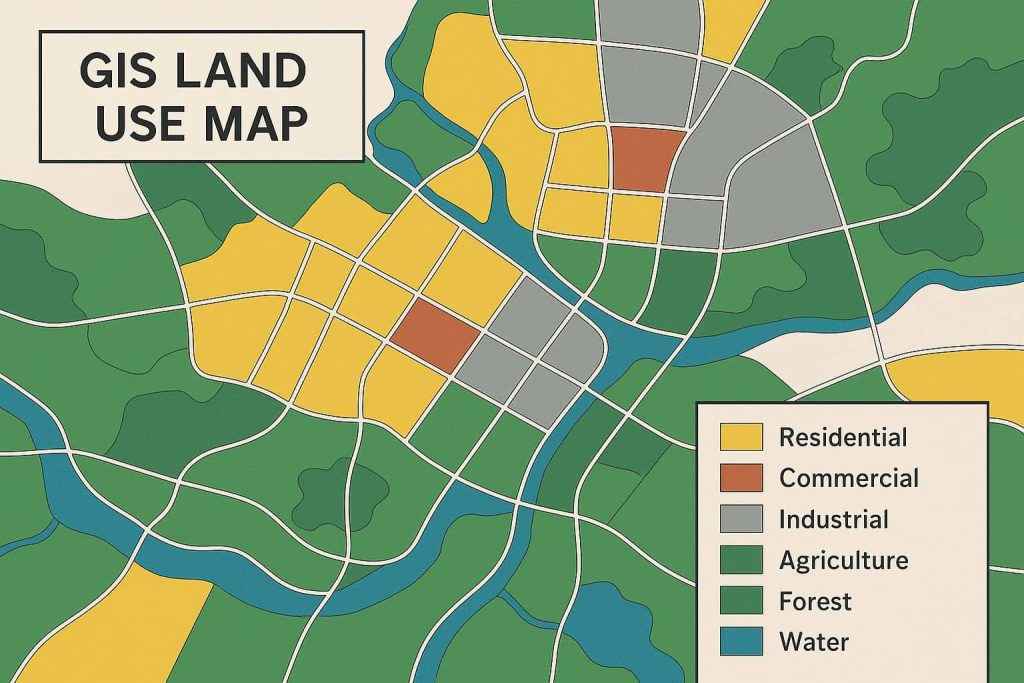
Common Land Use Categories (Color Coded):
| Land Use Type | Common Color | Example Features |
|---|---|---|
| Residential | Yellow | Houses, apartments, housing areas |
| Commercial | Red/Orange | Shops, offices, malls |
| Industrial | Gray | Factories, warehouses |
| Agriculture | Light Green | Farmlands, crop fields |
| Forest | Dark Green | Woodlands, conservation areas |
| Water | Blue | Rivers, lakes, reservoirs |
| Transportation | Black/Brown | Roads, railways, airports |
Land Use /Land Cover Map ‘1990‘
In this section Land Use Land Cover (LULC) maps of two years were compared. The LULC of the study area had changed dramatically during the period of 20 years. Therefore, the data interpretation and data analysis are based on the comparison of LULC for two different periods during the last 20 year period.
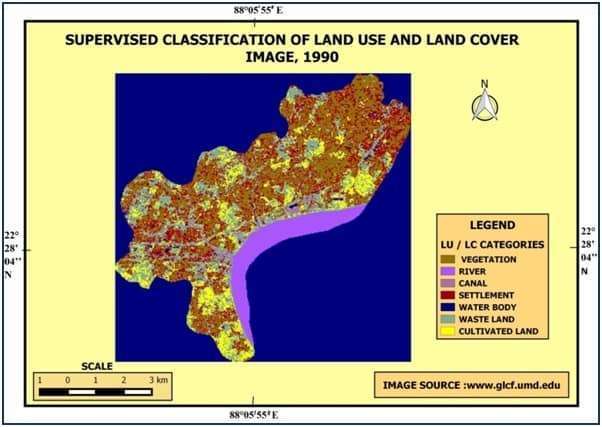
This area to show five land use and land cover categories, there are vegetation, settlement, water bodies, waste land and cultivated land. The result of supervised classification shows that there were seven main land uses in 1990. It indicates that most of the area of the municipality was covered by vegetation (39 %). According to the classified map based on 1990 next to the vegetation cover, there was settlement, cultivated land and waste land played very important role in the study area.
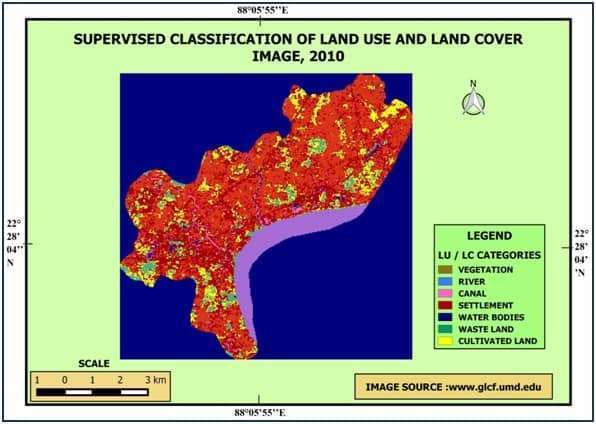
Land Use /Land Cover Map ‘2010‘
During the 20 year span in the Municipality settlement were prominently spread throughout the area (approx 40%). The vegetation cover, waste land and cultivated land losses were also accounted in the course of urbanization. Most of the waste land converted in the settlement remarkably.
Change Detection Analysis
The detection of changes involves the comparison between satellite imageries of 1990 and 2010. The method applied in this study is known as ‘image differencing’. The value of the pixels in 1990 image is simply subtracted from the value of the corresponding pixels in the 2010 image. Comparing the both images of the study area, conspicuous changes are recorded. Cultivated area and vegetation cover slowly reduce in the area due to increasing of built up area.
Esri Land Cover
Explore the Esri online Global Sentinel-2 10-Meter Land Use/Land Cover Map