NDVI Classification in ArcGIS
What is NDVI?
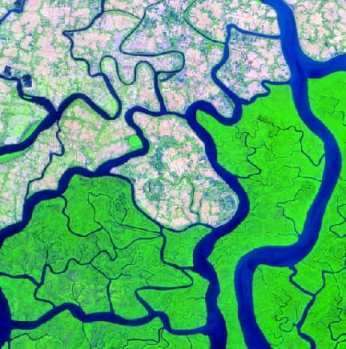
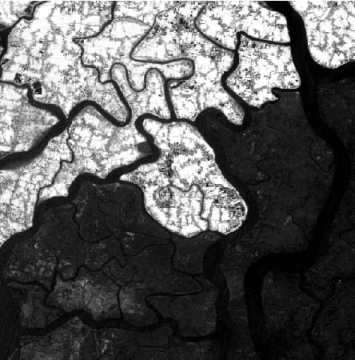
NDVI stand for Normalized Difference Vegetation Index describes the vegetation density and assessing changes in plant health. NDVI is calculated as a ratio between the red (R) and near-infrared (NIR). In this tutorial learn how to apply the NDVI Formula and calculate vegetation patterns.
NDVI Formula
(NIR – R) / (NIR + R)
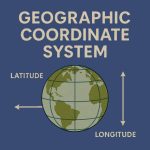
NDVI always ranges from -1 to +1.
NDVI in ArcGIS
To visualize the result with a color ramp, click the NDVI button on the Image Analysis window, or you can use the Colormap function with one of the NDVI color ramps.
How to Create NDVI Maps in ArcMap
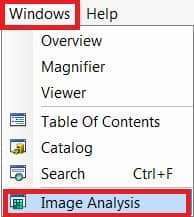
1. Click Windows on the main menu, then select Image Analysis.
2. Image Analysis window is appear, Click the Options button.
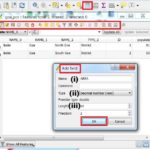
3. Now appear Image Analysis Options window, Click the NDVI tab.
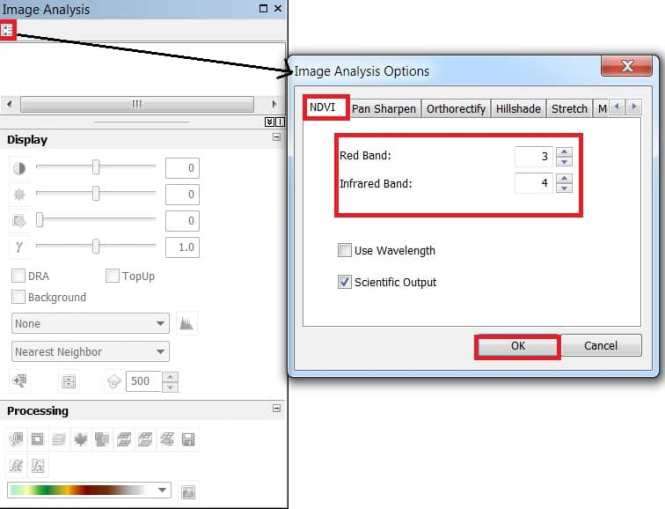
4. The Red band and Infrared band dfault value 3 and 4, that is correct. You can also change manually, the inputs for the Red Band- 3 and Infrared Band- 4.
5. Optionally, check Use Wavelength, and also Scientific Output.
[Use Wavelength– option will attempt to identify the correct bands to use if the wavelength information is in the dataset. If not, then the band numbers will be used.]
[Scientific Output– the Band Arithmetic function will output values between -1.0 and 1.0. Whereas, the NDVI function will scale the values to a range of 0–200, which can easily be rendered with a specific color ramp or color map.]
6. Click OK button.
7. Now select your data (ex..-gosaba_19.img), Click the NDVI button.